Home /
Expert Answers /
Chemistry /
answer-page-4-amp-5-pls-lab-chromatography-of-kool-aid-introduction-chromatography-is-a-separation-pa130
(Solved): answer page 4&5 pls Lab: Chromatography of Kool Aid Introduction Chromatography is a separation ...
answer page 4&5 pls
Lab: Chromatography of Kool Aid Introduction Chromatography is a separation technique useful in determining the chemical composition of a mixture. This technique was invented by a Russian Scientist Mikhail Tsvet, in the early 1900's. He noticed that plant materials separated into it various pigments when dissolved in a liquid known as the mobile phase and passed through a retaining material known as the stationary phase. In Greek, chroma means "color," and graphein means "to write." Thus, the term chromatography was derived to mean a technique used to separate various substances, (or colors) in a mixture. Background The technique of paper chromatography depends mainly on the interaction of the various components with the mobile phase which is usually a solvent, and the paper stationary phase which retains these components. The main interaction is due to variable degrees of intermolecular forces between the components of a mixture and these two phases. As the mobile phase moves along the stationary phase, the various components of the mixture move at different speeds just like a piece of wood, a pebble and a large boulder will move across a river bed at variable speeds. We will use the technique to find out if the flavors of Kool Aid have natural or artificial colors added to them. The artificial colors are usually food colors which are (FD&C) dyes. The term FD&C refers to Food, Drug and Cosmetic certified. There are several FD&C dyes available in the US. Even those these dyes may appear to be a certain color, they are actually mixtures of two or three colors. For example, the FD&C Green dye, contains blue and red colors which can be separated by paper chromatography. Experiment Overview In this experiment we will first study the separation of FD&C food dyes on paper followed by finding out which of these dyes are added to particular flavors of Kool Aid. The mobile phase (or carrier) will be a solvent such as NaCl solution. It will flow via capillary action along the stationary phase (paper). As the mobile phase moves through the paper, the components of the food dyes have different affinities for the cellulose in the paper. Some will have stronger intermolecular interactions than others. The separation depends on the relative tendency of each component to dissolve in the mobile phase and the relative tendency of each component to adsorb on the paper. The first step in the experiment involves spotting the paper with a food color. The paper is usually rectangular in shape and has the possibility to have several spots on one paper. Once the paper is spotted and the allowed to dry, it is then folded and placed in a beaker containing the mobile phase (NaCl solution). As the mobile phase move the spots by capillary action, the components in each spot separate out into bands. The position of the bands can be described by the R. value (retention factor) - the ratio of the distance traveled by component to the distance traveled by the mobile phase, from the position of the original sample mixture on the paper. R? = Distance travelled by spot/band (food dye) Distance travelled by solvent front (NaCl) (Equation 1)
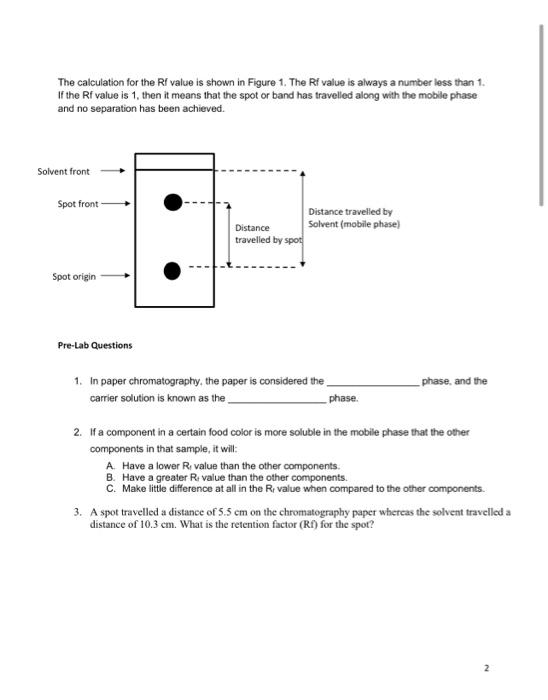
The calculation for the Rf value is shown in Figure 1. The Rf value is always a number less than 1. If the Rf value is 1, then it means that the spot or band has travelled along with the mobile phase and no separation has been achieved. Solvent front Spot front Spot origin Pre-Lab Questions Distance travelled by spot Distance travelled by Solvent (mobile phase) 1. In paper chromatography, the paper is considered the carrier solution is known as the phase, and the phase. 2. If a component in a certain food color is more soluble in the mobile phase that the other components in that sample, it will: A. Have a lower R value than the other components. B. Have a greater R. value than the other components. C. Make little difference at all in the R, value when compared to the other components. 3. A spot travelled a distance of 5.5 cm on the chromatography paper whereas the solvent travelled a distance of 10.3 cm. What is the retention factor (Rf) for the spot?
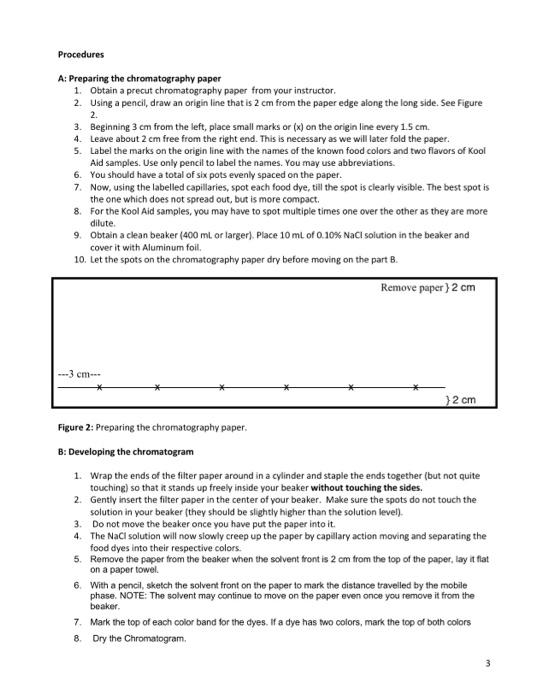
Procedures A: Preparing the chromatography paper 1. Obtain a precut chromatography paper from your instructor. 2. Using a pencil, draw an origin line that is 2 cm from the paper edge along the long side. See Figure 2. 3. 4. Beginning 3 cm from the left, place small marks or (x) on the origin line every 1.5 cm. Leave about 2 cm free from the right end. This is necessary as we will later fold the paper. 5. Label the marks on the origin line with the names of the known food colors and two flavors of Kool Aid samples. Use only pencil to label the names. You may use abbreviations. 6. You should have a total of six pots evenly spaced on the paper. 7. Now, using the labelled capillaries, spot each food dye, till the spot is clearly visible. The best spot is the one which does not spread out, but is more compact. 8. For the Kool Aid samples, you may have to spot multiple times one over the other as they are more dilute. 9. Obtain a clean beaker (400 ml or larger). Place 10 mL of 0.10% NaCl solution in the beaker and cover it with Aluminum foil. 10. Let the spots on the chromatography paper dry before moving on the part B. ---3 cm--- Remove paper) 2 cm }2 cm Figure 2: Preparing the chromatography paper. B: Developing the chromatogram 1. Wrap the ends of the filter paper around in a cylinder and staple the ends together (but not quite touching) so that it stands up freely inside your beaker without touching the sides. 2. Gently insert the filter paper in the center of your beaker. Make sure the spots do not touch the solution in your beaker (they should be slightly higher than the solution level). 3. Do not move the beaker once you have put the paper into it. 4. The NaCl solution will now slowly creep up the paper by capillary action moving and separating the food dyes into their respective colors. 5. Remove the paper from the beaker when the solvent front is 2 cm from the top of the paper, lay it flat on a paper towel. 6. With a pencil, sketch the solvent front on the paper to mark the distance travelled by the mobile phase. NOTE: The solvent may continue to move on the paper even once you remove it from the beaker. 7. Mark the top of each color band for the dyes. If a dye has two colors, mark the top of both colors 8. Dry the Chromatogram.
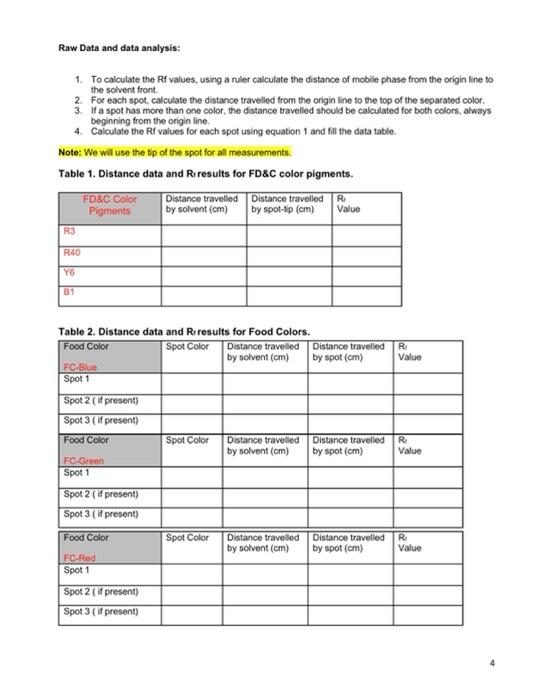
Raw Data and data analysis: 1. To calculate the Rf values, using a ruler calculate the distance of mobile phase from the origin line to the solvent front. 2. For each spot, calculate the distance travelled from the origin line to the top of the separated color. If a spot has more than one color, the distance travelled should be calculated for both colors, always beginning from the origin line. 3. 4. Calculate the Rf values for each spot using equation 1 and fill the data table. Note: We will use the tip of the spot for all measurements. Table 1. Distance data and Riresults for FD&C color pigments. R3 R40 Y6 81 FD&C Color Pigments FC-Blue Spot 1 Table 2. Distance data and Riresults for Food Colors. Food Color Spot Color Spot 2 (if present) Spot 3 (if present) Food Color FC-Green Spot 1 Spot 2 (if present) Spot 3 (if present) Food Color FC-Red Spot 1 Distance travelled by solvent (cm) Spot 2 (if present) Spot 3 (if present) Spot Color Distance travelled by spot-tip (cm) Spot Color Distance travelled by solvent (cm) Distance travelled by solvent (cm) Distance travelled by solvent (cm) R? Value Distance travelled by spot (cm) Distance travelled by spot (cm) Distance travelled by spot (cm) R Value R Value R Value
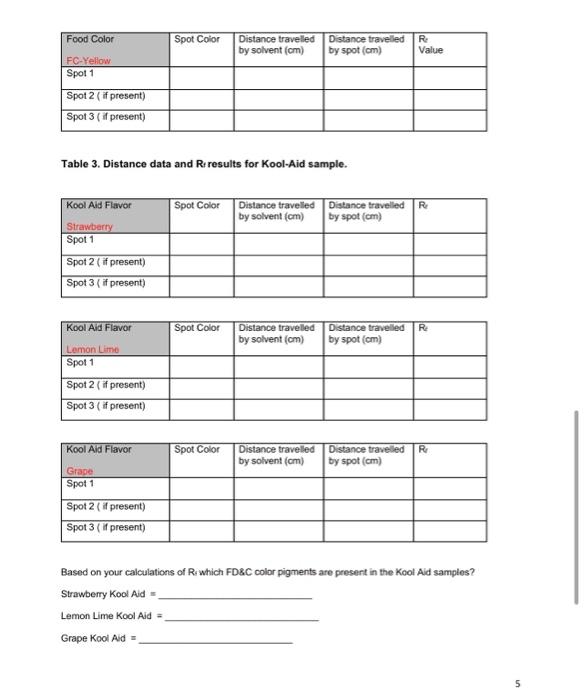
Food Color FC-Yellow Spot 1 Spot 2 (if present) Spot 3 (if present) Kool Aid Flavor Strawberry Spot 1 Spot 2 (if present) Spot 3 (if present) Table 3. Distance data and R: results for Kool-Aid sample. Kool Aid Flavor Lemon Lime Spot 1 Spot 2 (if present) Spot 3 (if present) Kool Aid Flavor Grape Spot 1 Spot Color Spot 2 (if present) Spot 3 (if present) Distance travelled by solvent (cm) Spot Color Distance travelled by solvent (cm) Spot Color Spot Color Distance travelled by solvent (cm) Distance travelled by spot (cm) Distance travelled by solvent (cm) R? Value Distance travelled R? by spot (cm) Distance travelled Re by spot (cm) Distance travelled R by spot (cm) Based on your calculations of Ri which FD&C color pigments are present in the Kool Aid samples? Strawberry Kool Aid = Lemon Lime Kool Aid = Grape Kool Aid = 5