Home /
Expert Answers /
Economics /
and-is-shown-by-the-area-in-the-graph-below-total-surplus-net-social-benefit-is-maximized-at-pa121
(Solved): and is shown by the area In the graph below, total surplus (net social benefit) is maximized at \( ...
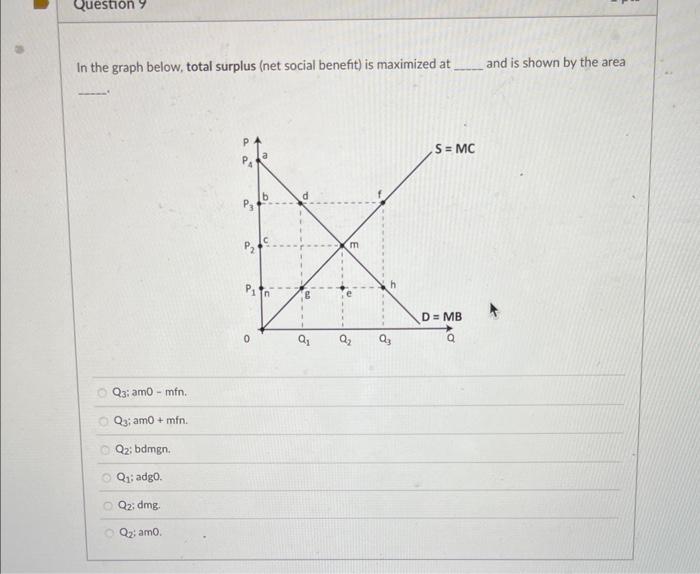
and is shown by the area In the graph below, total surplus (net social benefit) is maximized at \( Q_{3} ; \) amo - mfn. \( Q_{3} ; a m 0+m f n \). \( Q_{2} \); bdmgn. \( \mathrm{Q}_{1} \) : adgo. \( Q_{2} \); dmg. \( \mathrm{Q}_{2}: \operatorname{am0} \).
Expert Answer
Ans :- Social surplus is maximized in the e