Home /
Expert Answers /
Mechanical Engineering /
a-transfer-function-has-the-following-bode-plot-in-figure-6-figure-6-bode-plot-sketch-the-nyquist-pa970
(Solved): A transfer function has the following Bode plot in Figure 6 Figure 6 Bode plot Sketch the Nyquist ...
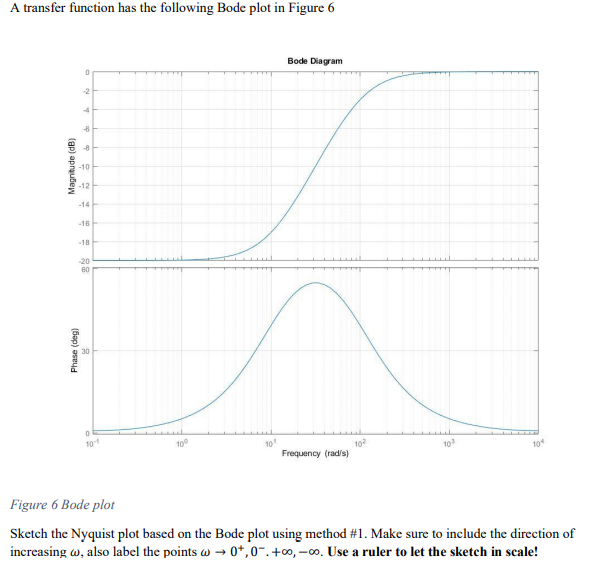
A transfer function has the following Bode plot in Figure 6 Figure 6 Bode plot Sketch the Nyquist plot based on the Bode plot using method \#1. Make sure to include the direction of increasing \( \omega \), also label the points \( \omega \rightarrow 0^{+}, 0^{-} .+\infty,-\infty \). Use a ruler to let the sketch in scale!