(Solved): A researcher is investigating whether a reading intervention program improves reading comprehension ...
A researcher is investigating whether a reading intervention program improves reading comprehension for second graders. He collects a random sample of second graders and randomly assigns each second grader to participate in the reading intervention program or not participate in the program. The researcher knows that the standard deviation of the reading comprehension scores among all second graders is ? = 25.24.
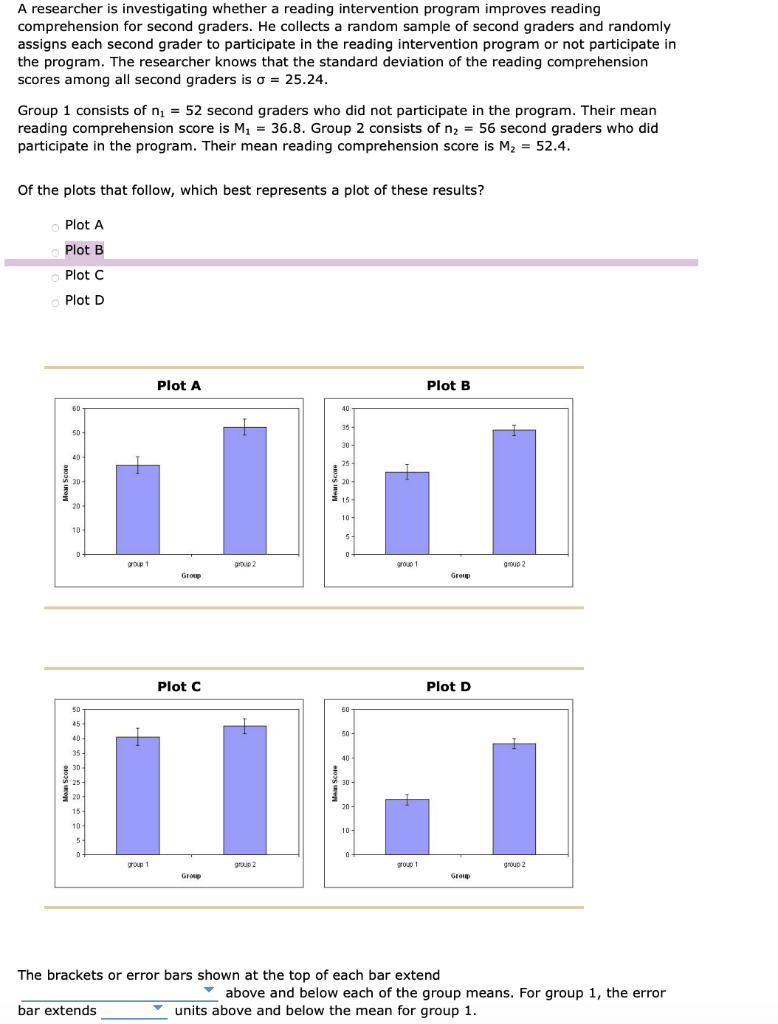
Group 1 consists of n? = 52 second graders who did not participate in the program. Their mean reading comprehension score is M? = 36.8. Group 2 consists of n? = 56 second graders who did participate in the program. Their mean reading comprehension score is M? = 52.4.
Of the plots that follow, which best represents a plot of these results?
Plot A
Plot B
Plot C
Plot D
| Plot A | Plot B |
| Plot C | Plot D |
The brackets or error bars shown at the top of each bar extend above and below each of the group means. For group 1, the error bar extends units above and below the mean for group 1.
Grade It Now
Save & Continue