(Solved): A regional planner employed by a public university is studying the demographics of nine counties in ...
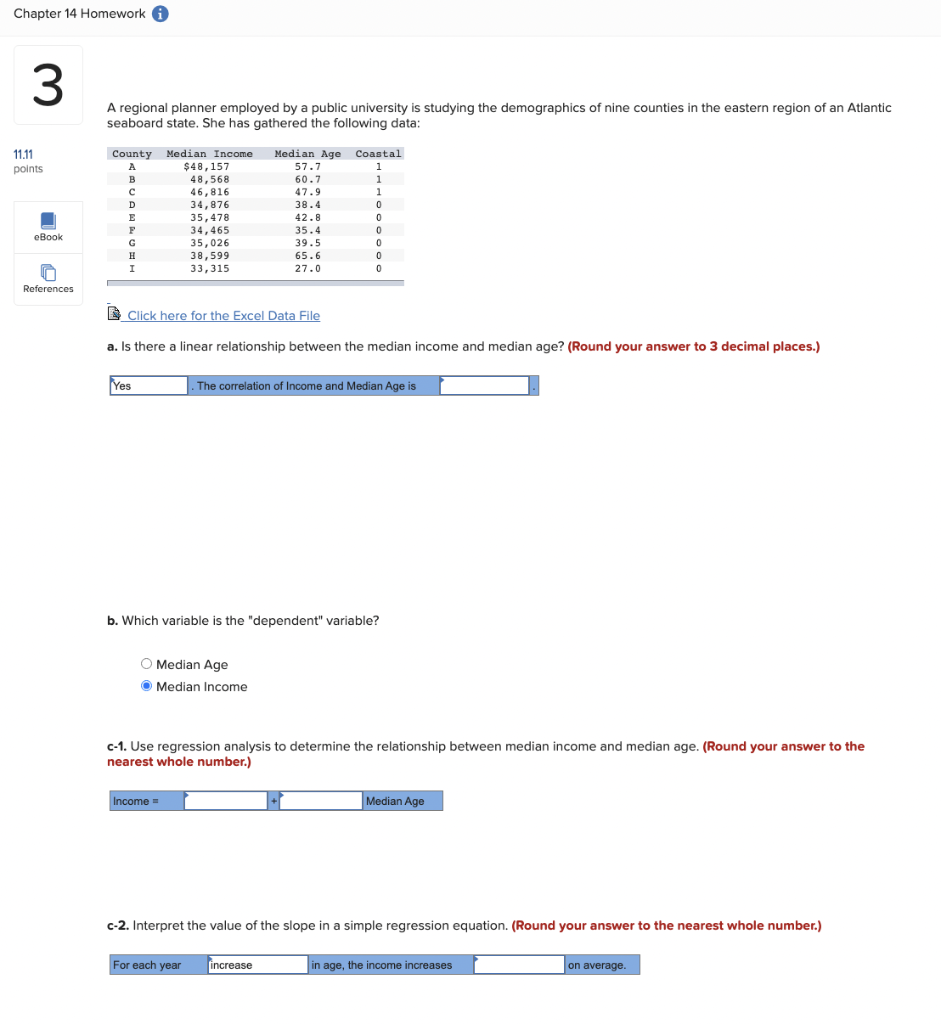
A regional planner employed by a public university is studying
the demographics of nine counties in the eastern region of an
Atlantic seaboard state. She has gathered the following data:
| County | Median Income | Median Age | Coastal | ||
| A | $ | 48,157 | 57.7 | 1 | |
| B | 48,568 | 60.7 | 1 | ||
| C | 46,816 | 47.9 | 1 | ||
| D | 34,876 | 38.4 | 0 | ||
| E | 35,478 | 42.8 | 0 | ||
| F | 34,465 | 35.4 | 0 | ||
| G | 35,026 | 39.5 | 0 | ||
| H | 38,599 | 65.6 | 0 | ||
| I | 33,315 | 27.0 | 0 | ||
Click here for the Excel Data File
a. Is there a linear relationship between the
median income and median age? (Round your answer to 3
decimal places.)
b. Which variable is the "dependent"
variable?
multiple choice 1
-
Median Age
-
Median Income
c-1. Use regression analysis to determine the
relationship between median income and median
age. (Round your answer to the nearest whole
number.)
c-2. Interpret the value of the slope in a simple
regression equation. (Round your answer to the nearest
whole number.)
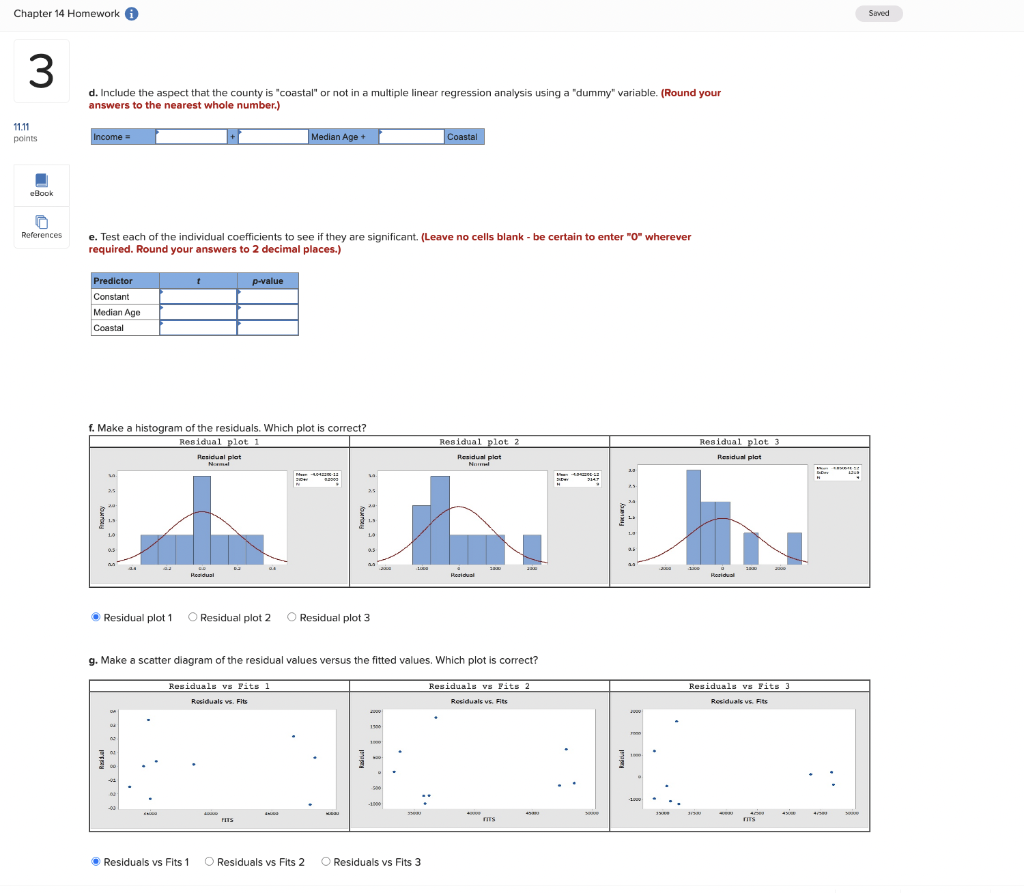
d. Include the aspect that the county is
"coastal" or not in a multiple linear regression analysis using a
"dummy" variable. (Round your answers to the nearest
whole number.)
e. Test each of the individual coefficients
to see if they are significant. (Leave no cells blank
- be certain to enter "0" wherever required. Round your answers to
2 decimal places.)
f. Make a histogram of the residuals. Which
plot is correct?
| Residual plot 1 | Residual plot 2 | Residual plot 3 |
multiple choice 2
-
Residual plot 1
-
Residual plot 2
-
Residual plot 3
g. Make a scatter diagram of the residual
values versus the fitted values. Which plot is correct?
| Residuals vs Fits 1 | Residuals vs Fits 2 | Residuals vs Fits 3 |
multiple choice 3
-
Residuals vs Fits 1
-
Residuals vs Fits 2
-
Residuals vs Fits 3
Expert Answer
SOLUTION: a. Yes, the correlation of income and median age is 0.721