Home /
Expert Answers /
Advanced Physics /
a-presure-versus-volume-pv-diagram-for-a-system-is-shown-in-the-figure-the-arrows-of-the-curve-i-pa549
(Solved): A presure versus volume (pV) diagram for a system is shown in the figure. The arrows of the curve i ...
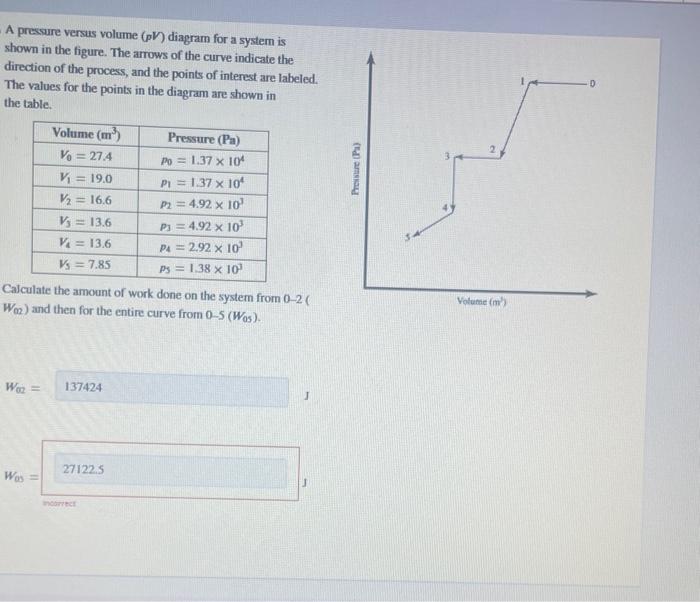
A presure versus volume diagram for a system is shown in the figure. The arrows of the curve indicate the direction of the process, and the points of interest are labeled. The values for the points in the diagram are shown in the table. CaJculate the amount of work done on the system from ( and then for the entire curve from . J
Expert Answer
Amount of work done = - (Area under the p vs v curve) 1. 0 -> 2 W = [ (10000)(