Home /
Expert Answers /
Statistics and Probability /
a-draw-a-normal-curve-with-the-parameters-labeled-choose-the-correct-graph-below-a-b-c-d-pa923
(Solved): (a) Draw a normal curve with the parameters labeled. Choose the correct graph below. A. B. C. D. ( ...
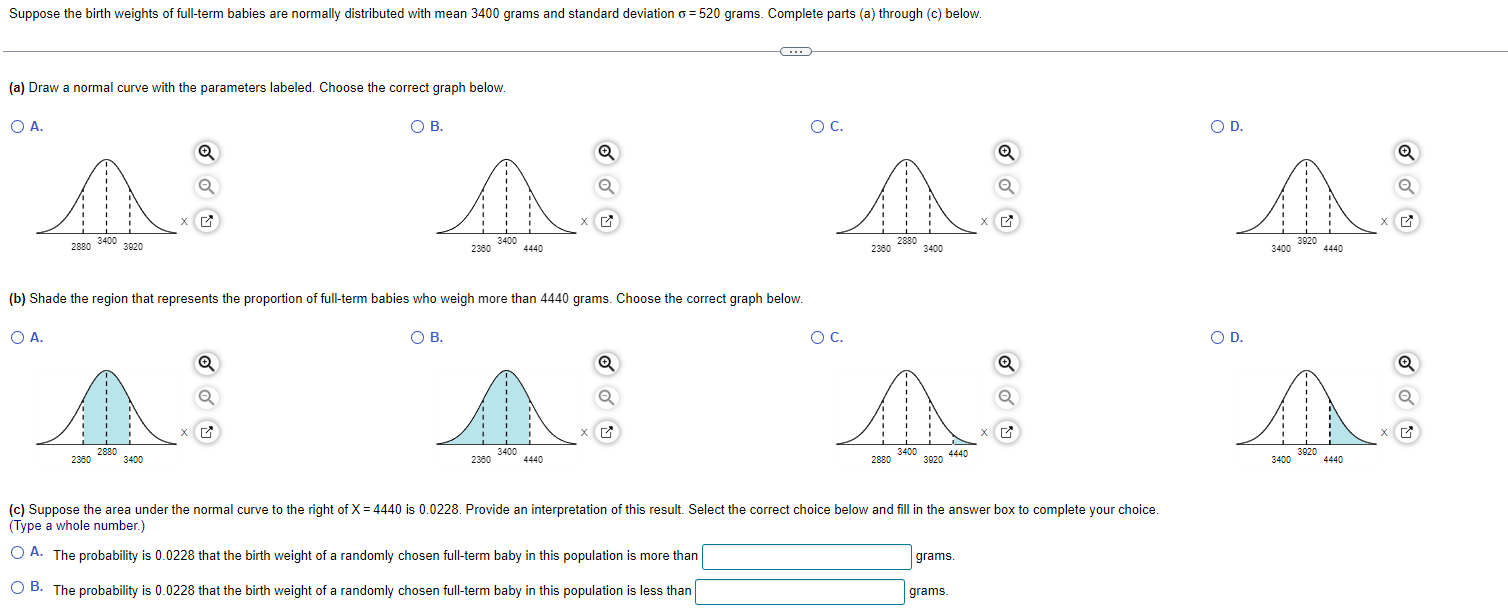
(a) Draw a normal curve with the parameters labeled. Choose the correct graph below. A. B. C. D. (b) Shade the region that represents the proportion of full-term babies who weigh more than 4440 grams. Choose the correct graph below. A. B. C. J. (Type a whole number.) A. The probability is \( 0.0228 \) that the birth weight of a randomly chosen full-term baby in this population is more than grams. B. The probability is \( 0.0228 \) that the birth weight of a randomly chosen full-term baby in this population is less than grams.
Expert Answer
a. The normal distribution curve is bell-shaped, with positions of points of the following form: ?+? ??? ? Here, ?=3,400, ?=520, both in grams. Thus,