Home /
Expert Answers /
Civil Engineering /
a-constant-head-permeability-test-is-being-conducted-on-a-sample-of-sand-the-test-setup-is-shown-in-pa458
(Solved): A constant head permeability test is being conducted on a sample of sand. The test setup is shown in ...
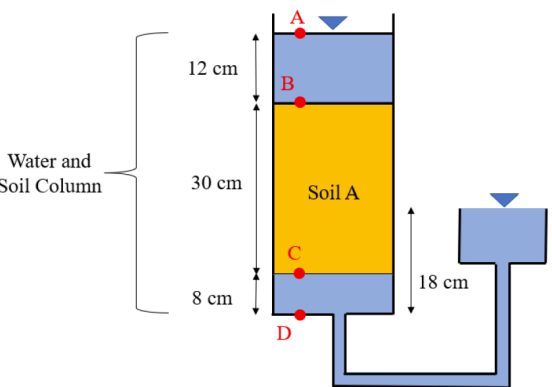
A constant head permeability test is being conducted on a sample of sand. The test setup is shown in the figure below.
a. Plot a graph containing the following: (i) total head ht, (ii) elevation head he, and (iii) pressure head hp throughout the height of the column. Include a table of the respective values at points A, B, C and D.
b. Assuming the permeability of Soil A is k = 5 x 10⁻⁴ cm/s and the diameter of the test cylinder (where Soil A is located) is 20 cm, compute the total rate of flow (q) in cm3 /s.
Expert Answer
Solution(1) Since this is an example