Home /
Expert Answers /
Physics /
a-common-graphical-representation-of-motion-along-a-straight-line-is-the-v-vs-t-graph-pa260
(Solved): A common graphical representation of motion along a straight line is the \( v \) vs. \( t \) graph ...
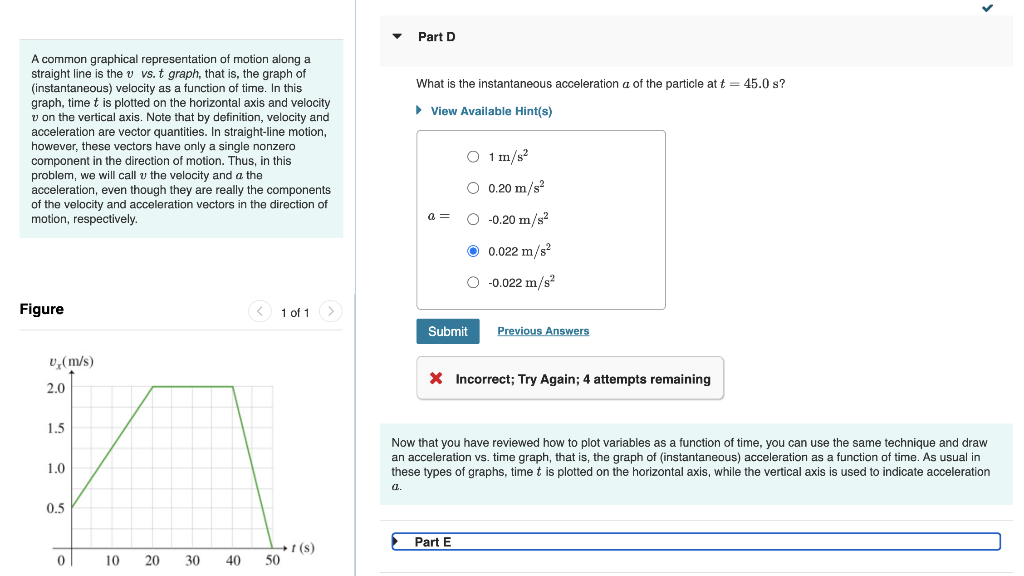
A common graphical representation of motion along a straight line is the \( v \) vs. \( t \) graph, that is, the graph of (instantaneous) velocity as a function of time. In this What is the instantaneous acceleration \( a \) of the particle at \( t=45.0 \mathrm{~s} ? \) graph, time \( t \) is plotted on the horizontal axis and velocity \( v \) on the vertical axis. Note that by definition, velocity and acceleration are vector quantities. In straight-line motion, however, these vectors have only a single nonzero component in the direction of motion. Thus, in this problem, we will call \( v \) the velocity and \( a \) the acceleration, even though they are really the components of the velocity and acceleration vectors in the direction of motion, respectively. motion, respectively. Figure X Incorrect; Try Again; 4 attempts remaining Now that you have reviewed how to plot variables as a function of time, you can use the same technique and draw an acceleration vs. time graph, that is, the graph of (instantaneous) acceleration as a function of time. As usual in these types of graphs, time \( t \) is plotted on the horizontal axis, while the vertical axis is used to indicate acceleration \( a \).
Expert Answer
Given data - Time = 45 s According to given data we know that Now a