Home /
Expert Answers /
Statistics and Probability /
90-this-table-shows-the-distribution-of-winning-times-in-the-kentucky-derby-a-horse-race-over-87-pa972
(Solved): 90 This table shows the distribution of winning times in the Kentucky Derby (a horse race) over 87 ...
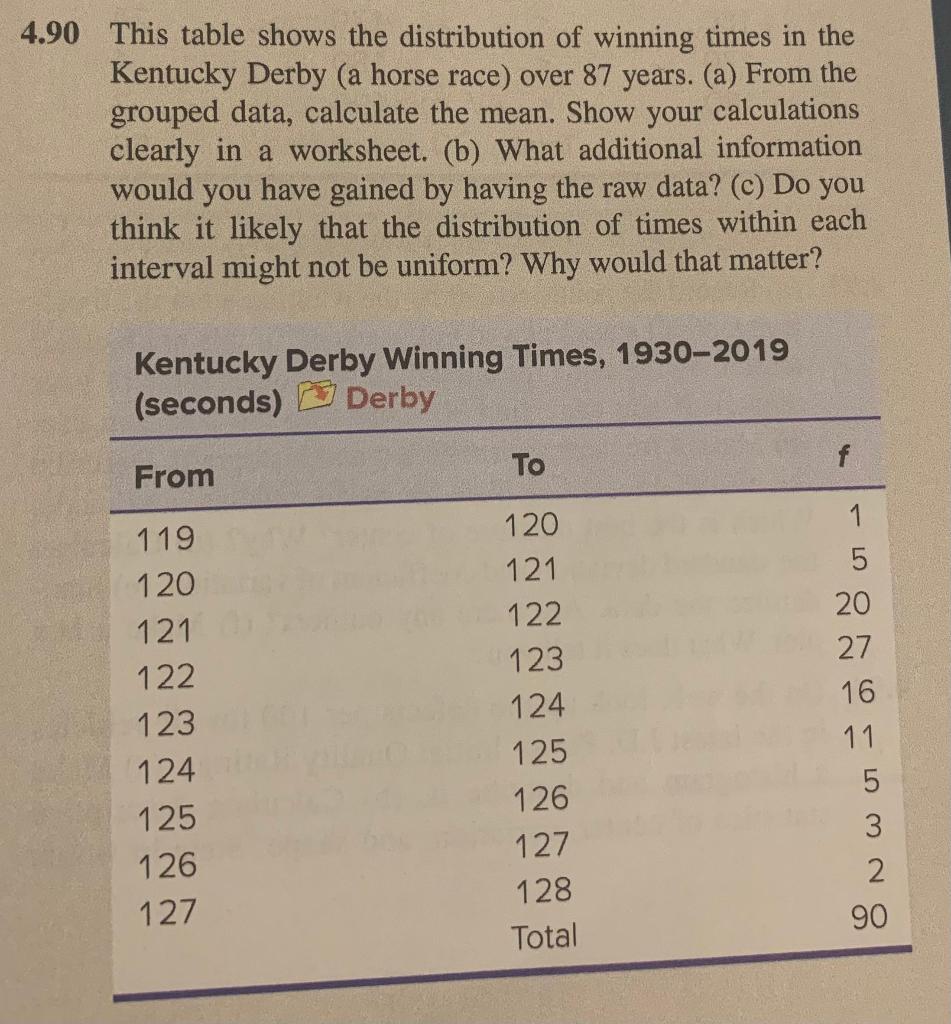
90 This table shows the distribution of winning times in the Kentucky Derby (a horse race) over 87 years. (a) From the grouped data, calculate the mean. Show your calculations clearly in a worksheet. (b) What additional information would you have gained by having the raw data? (c) Do you think it likely that the distribution of times within each interval might not be uniform? Why would that matter? Kentucky Derby Winning Times, 1930-2019 lcoconds) \( P Y \) Derby
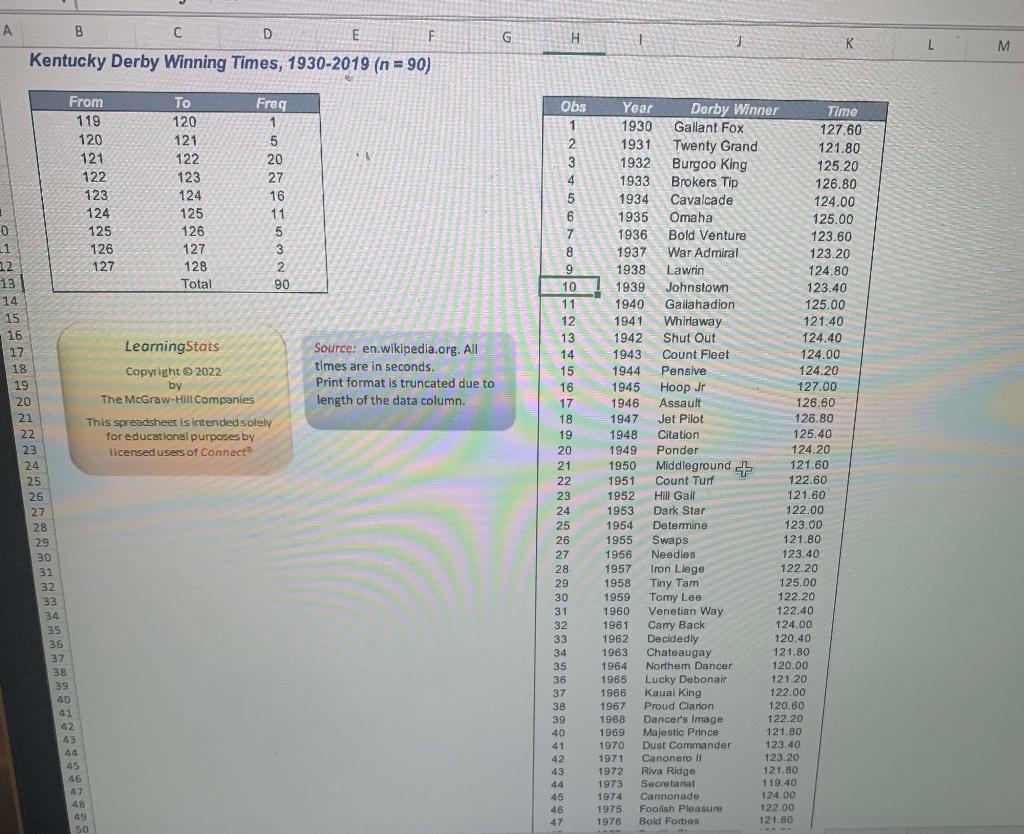
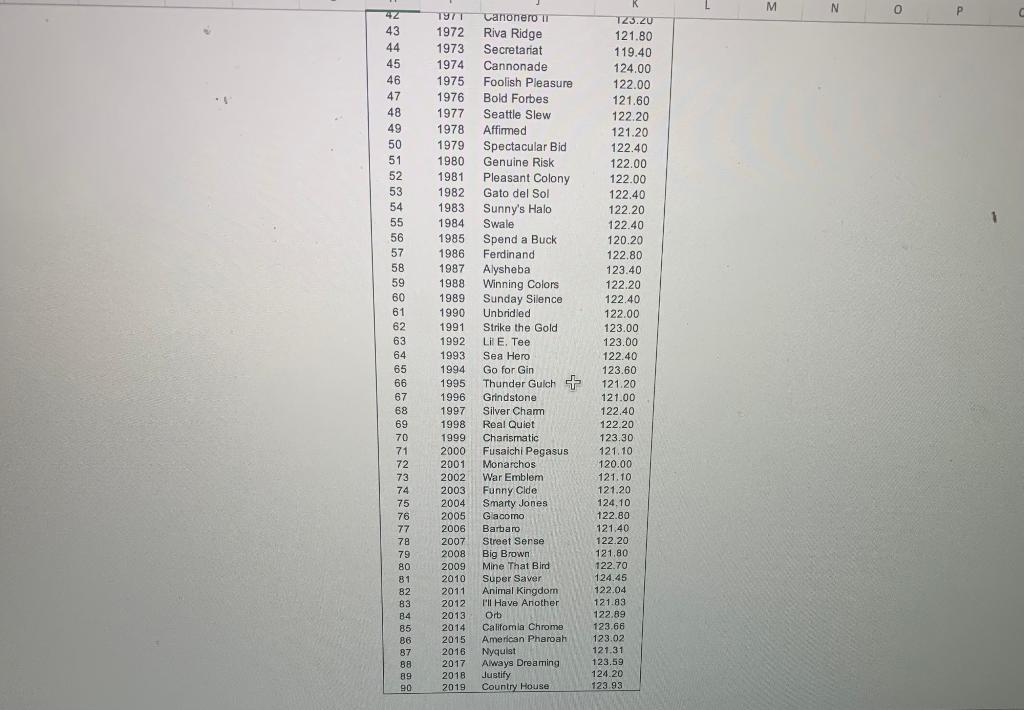
Kentucky Derby Winning Times, 1930-2019 \( (n=90) \) \( \begin{array}{ll}\text { LearningStats } & \text { Source: en.wikipedia.org. All } \\ \begin{array}{c}\text { Copyright } @ 2022 \\ \text { by }\end{array} & \text { times are in seconds. } \\ \text { Print format is truncated due to } \\ \text { lengraw-Hill Companies } & \\ \text { length of the data column. } \\ \text { foreducational purposes by } & \end{array} \)