Home /
Expert Answers /
Economics /
8-natural-monopoly-analysis-the-following-graph-gives-the-demand-d-curve-for-satellite-tv-servic-pa344
(Solved): 8. Natural monopoly analysis The following graph gives the demand (D) curve for satellite TV servic ...
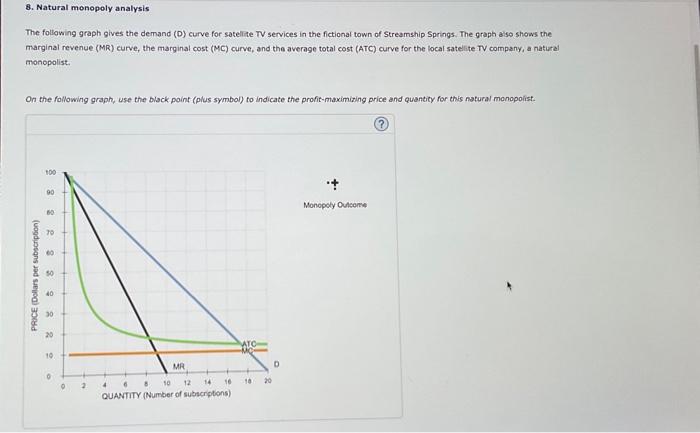
8. Natural monopoly analysis The following graph gives the demand (D) curve for satellite TV services in the fictional town of Streamship Springs. The graph aiso shows the marginal revenue (MR) curve, the marginal cost (MC) curve, and the average total cost (ATC) curve for the local satelite TV company, a natiral monopolist. On the following graph, use the black point (plus symbal) to indicate the profit-maximizing price and quantity for this natural monopolist.
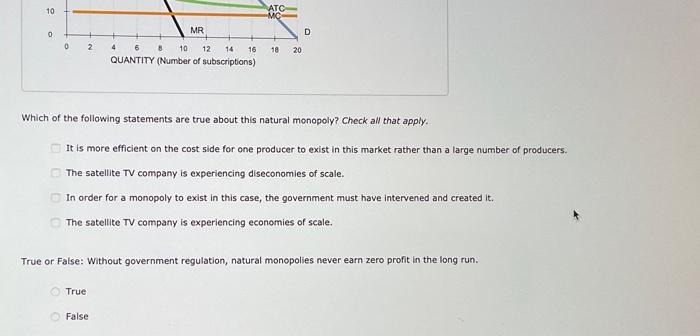
Which of the following statements are true about this natural monopoly? Check all that apply. It is more efficient on the cost side for one producer to exist in this market rather than a large number The satellite TV company is experiencing diseconomies of scale. In order for a monopoly to exist in this case, the government must have intervened and created it. The satellite TV company is experiencing economies of scale. True or False: Without government regulation, natural monopolies never earn zero profit in the long run. True False