Home /
Expert Answers /
Economics /
6-figure-1-shows-aggregate-planned-expenditure-when-the-price-level-is-100-when-the-price-level-pa277
(Solved): 6. Figure 1 shows aggregate planned expenditure when the price level is 100 . When the price level ...
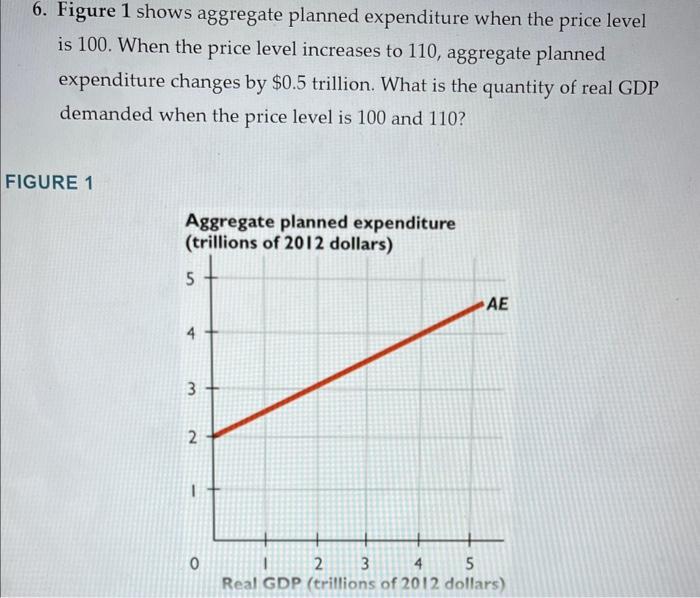
6. Figure 1 shows aggregate planned expenditure when the price level is 100 . When the price level increases to 110 , aggregate planned expenditure changes by \( \$ 0.5 \) trillion. What is the quantity of real GDP demanded when the price level is 100 and 110 ? FIGURE 1
Expert Answer
Given - Graph of Aggregate planned expenditure . In figure it has been showing the aggregate planned expenditure when the price levels is 100 . It is