Home /
Expert Answers /
Economics /
5-the-following-graph-depicts-the-marginal-private-cost-mpc-and-marginal-social-cost-msc-of-a-pa300
(Solved): 5. The following graph depicts the marginal private cost (MPC) and marginal social cost (MSC) of a ...
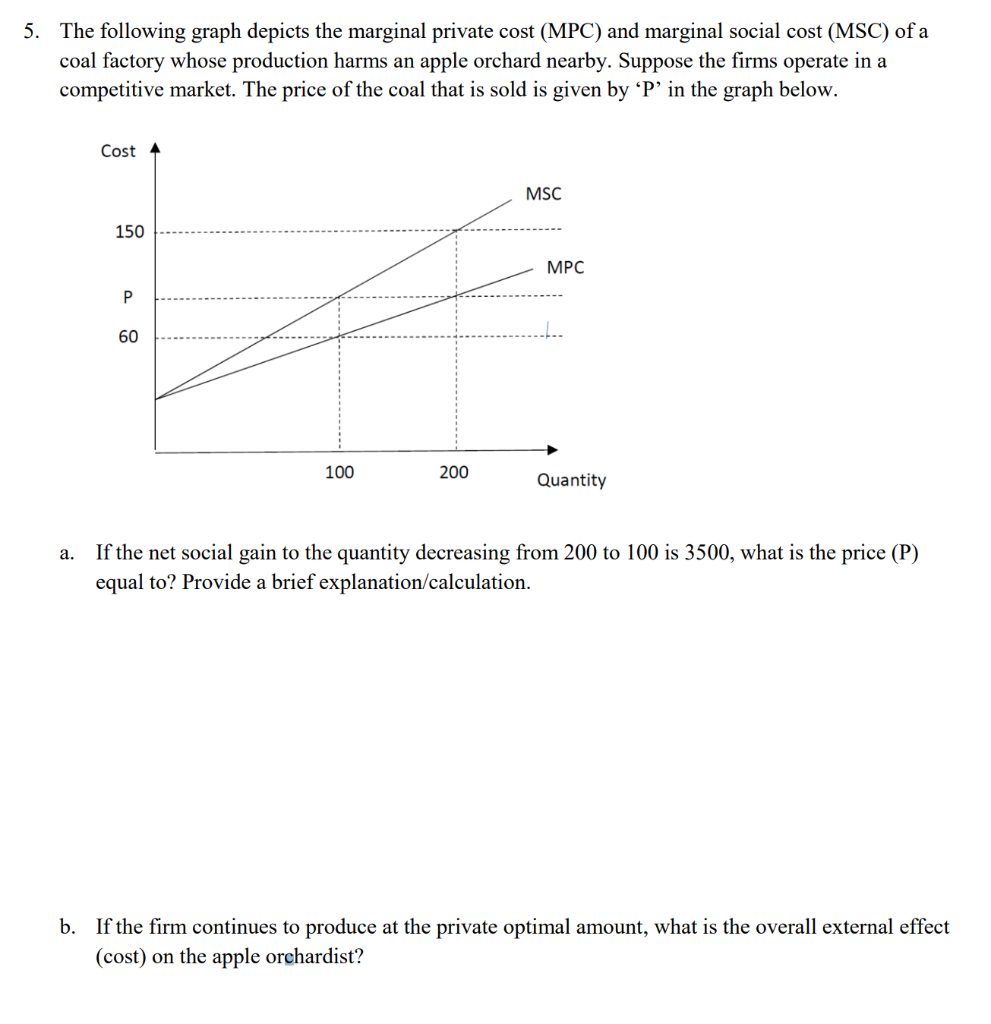
5. The following graph depicts the marginal private cost (MPC) and marginal social cost (MSC) of a coal factory whose production harms an apple orchard nearby. Suppose the firms operate in a competitive market. The price of the coal that is sold is given by 'P' in the graph below. Cost MSC 150 MPC P 60 # 100 200 Quantity a. If the net social gain to the quantity decreasing from 200 to 100 is 3500, what is the price (P) equal to? Provide a brief explanation/calculation. b. If the firm continues to produce at the private optimal amount, what is the overall external effect (cost) on the apple orchardist?