Home /
Expert Answers /
Mechanical Engineering /
5-the-diagram-below-shows-a-speed-time-graph-of-an-object-which-starts-from-rest-and-accelerat-pa191
(Solved): 5. The diagram below shows a speed time graph of an object which starts from rest and accelerat ...
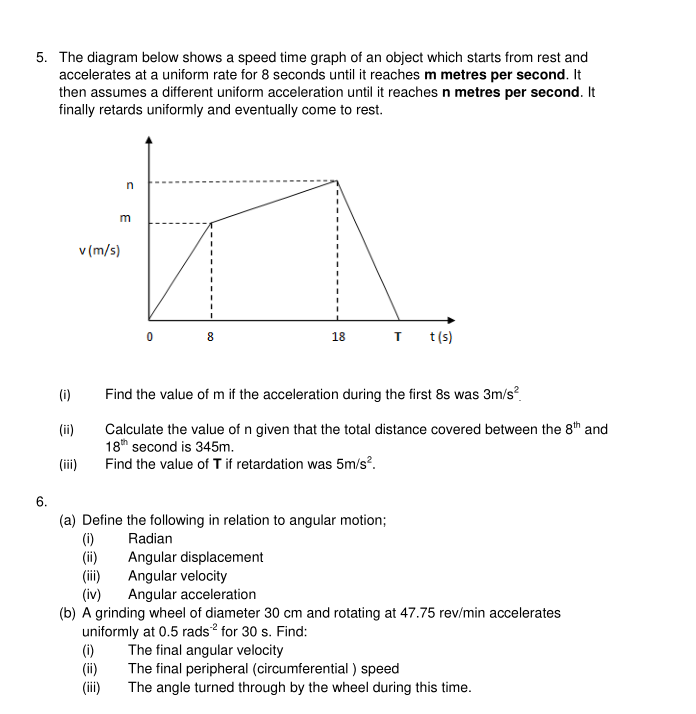
5. The diagram below shows a speed time graph of an object which starts from rest and accelerates at a uniform rate for 8 seconds until it reaches metres per second. It then assumes a different uniform acceleration until it reaches metres per second. It finally retards uniformly and eventually come to rest. (i) Find the value of if the acceleration during the first was . (ii) Calculate the value of given that the total distance covered between the and second is . (iii) Find the value of if retardation was . 6. (a) Define the following in relation to angular motion; (i) Radian (ii) Angular displacement (iii) Angular velocity (iv) Angular acceleration (b) A grinding wheel of diameter and rotating at accelerates uniformly at 0.5 rads for . Find: (i) The final angular velocity (ii) The final peripheral (circumferential) speed (iii) The angle turned through by the wheel during this time.