Home /
Expert Answers /
Economics /
5-labor-unions-employee-power-the-following-graph-shows-the-labor-market-for-plumbers-assume-t-pa510
(Solved): 5. Labor unions - Employee power The following graph shows the labor market for plumbers. Assume t ...
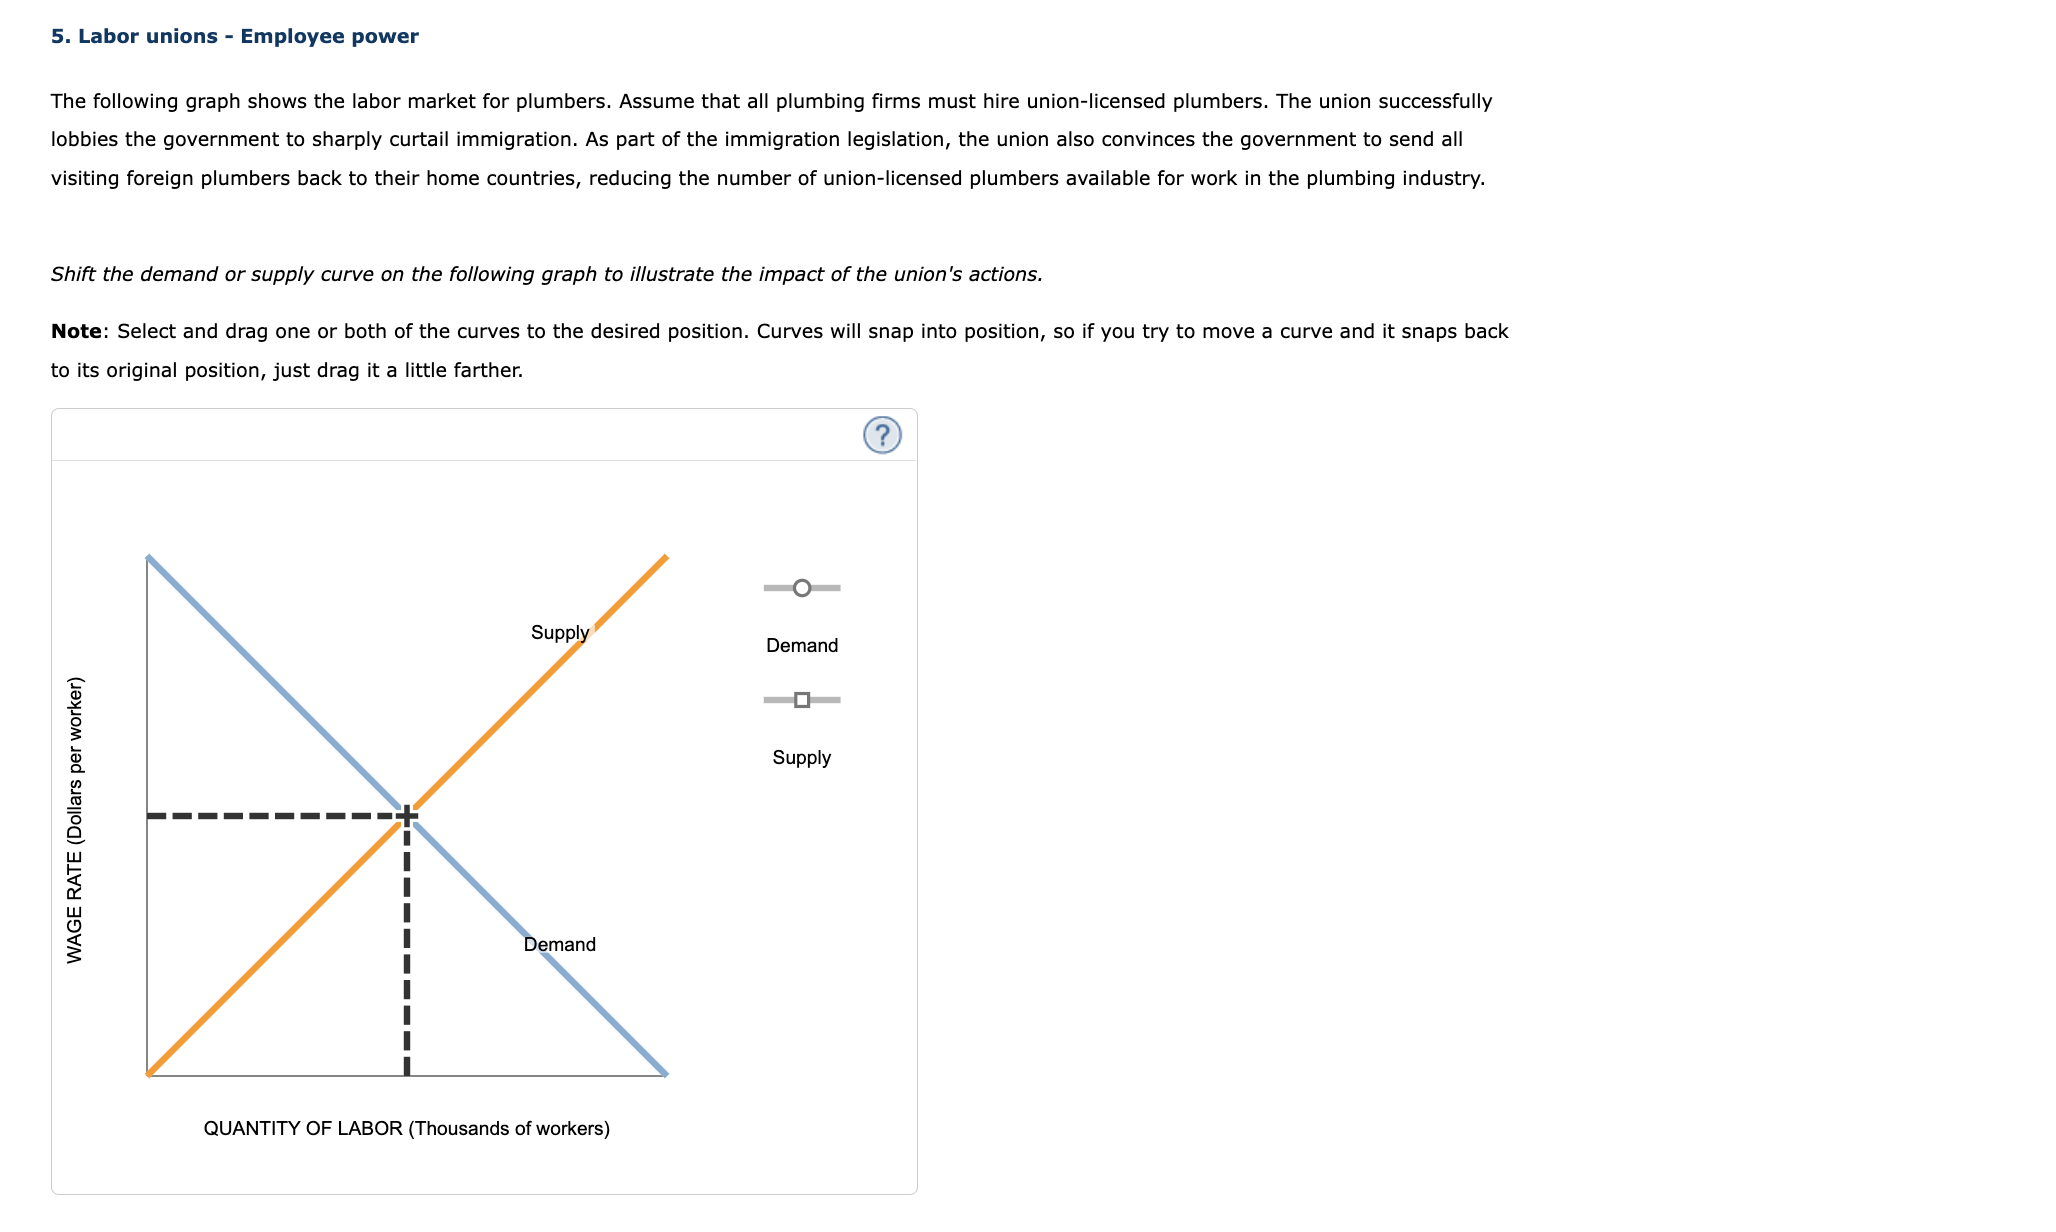
5. Labor unions - Employee power The following graph shows the labor market for plumbers. Assume that all plumbing firms must hire union-licensed plumbers. The union successfully lobbies the government to sharply curtail immigration. As part of the immigration legislation, the union also convinces the government to send all visiting foreign plumbers back to their home countries, reducing the number of union-licensed plumbers available for work in the plumbing industry. Shift the demand or supply curve on the following graph to illustrate the impact of the union's actions. Note: Select and drag one or both of the curves to the desired position. Curves will snap into position, so if you try to move a curve and it snaps back to its original position, just drag it a little farther.
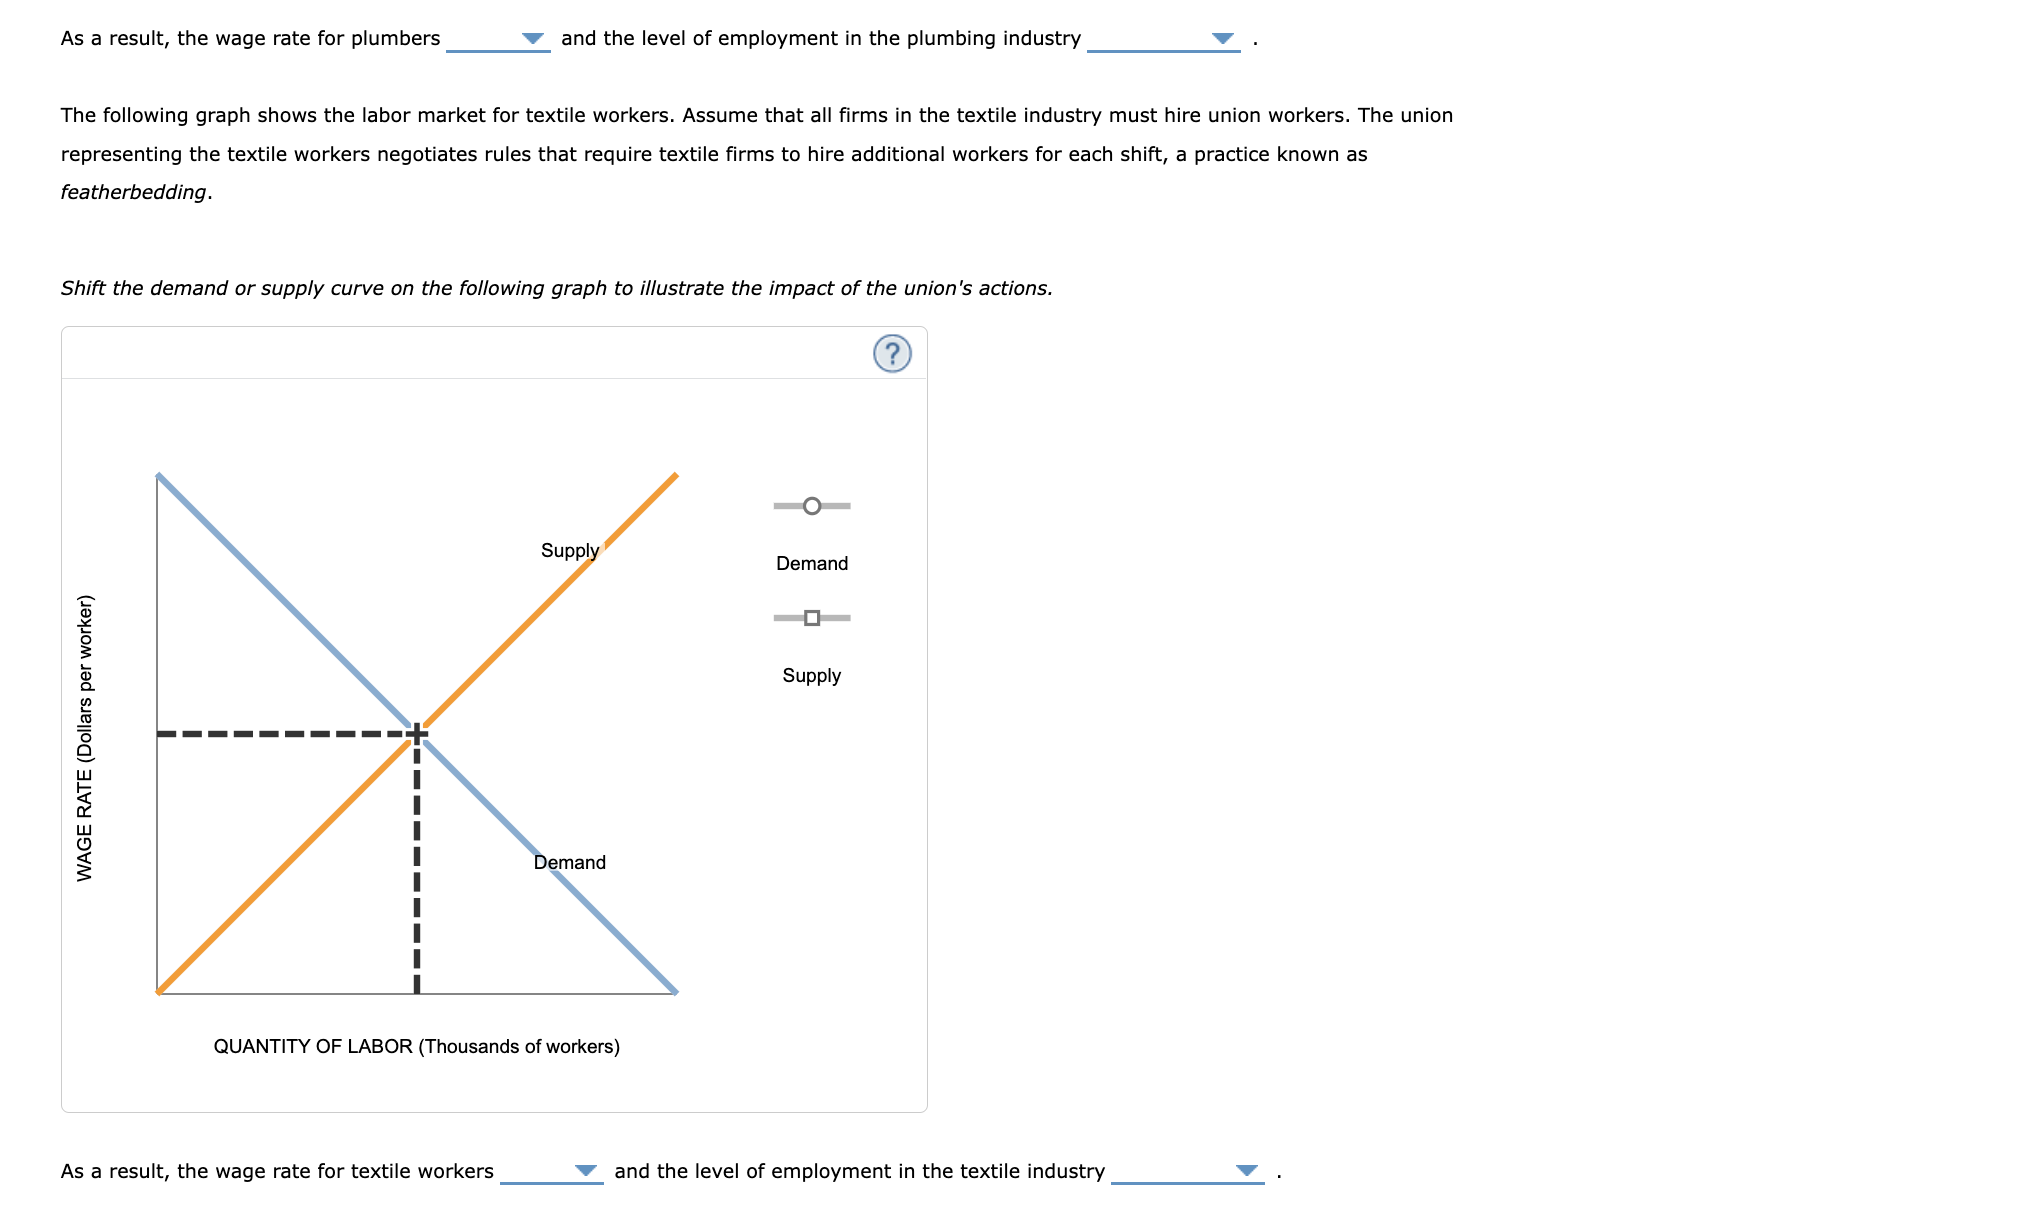
As a result, the wage rate for plumbers and the level of employment in the plumbing industry The following graph shows the labor market for textile workers. Assume that all firms in the textile industry must hire union workers. The union representing the textile workers negotiates rules that require textile firms to hire additional workers for each shift, a practice known as featherbedding. Shift the demand or supply curve on the following graph to illustrate the impact of the union's actions. As a result, the wage rate for textile workers and the level of employment in the textile industry
Expert Answer
a) With no immigration and sending foreign plumbers also back will decrease the supply of plumbers. Thus the supply cu

