Home /
Expert Answers /
Economics /
4-use-the-above-graph-which-shows-a-lorenz-curve-for-income-distribution-in-the-country-of-utopia-pa701
(Solved): 4. Use the above graph, which shows a Lorenz curve for income distribution in the country of Utopia ...
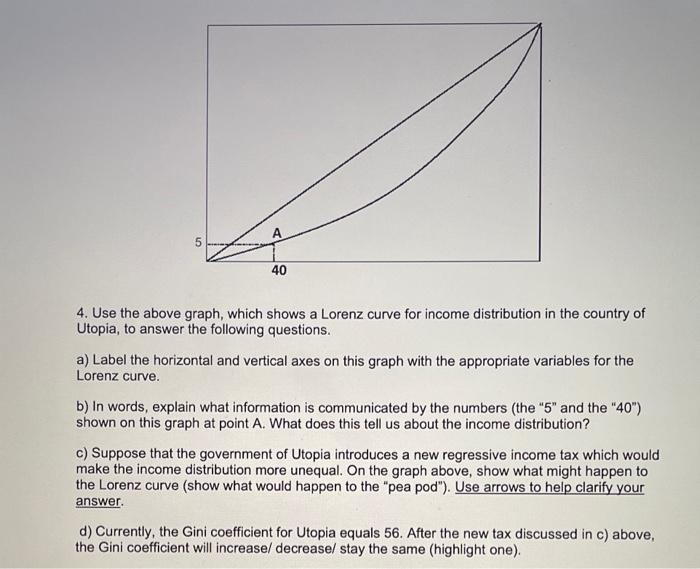
4. Use the above graph, which shows a Lorenz curve for income distribution in the country of Utopia, to answer the following questions. a) Label the horizontal and vertical axes on this graph with the appropriate variables for the Lorenz curve. b) In words, explain what information is communicated by the numbers (the " 5 " and the " 40 ") shown on this graph at point \( \mathrm{A} \). What does this tell us about the income distribution? c) Suppose that the government of Utopia introduces a new regressive income tax which would make the income distribution more unequal. On the graph above, show what might happen to the Lorenz curve (show what would happen to the "pea pod"). Use arrows to help clarify your answer. d) Currently, the Gini coefficient for Utopia equals 56. After the new tax discussed in c) above, the Gini coefficient will increase/ decrease/ stay the same (highlight one).
Expert Answer
Lorenz curve is defined as the the graphical re