Home /
Expert Answers /
Economics /
4-supply-and-demand-for-loanable-funds-the-following-graph-shows-the-market-for-loanable-funds-in-pa597
(Solved): 4. Supply and demand for loanable funds The following graph shows the market for loanable funds in ...
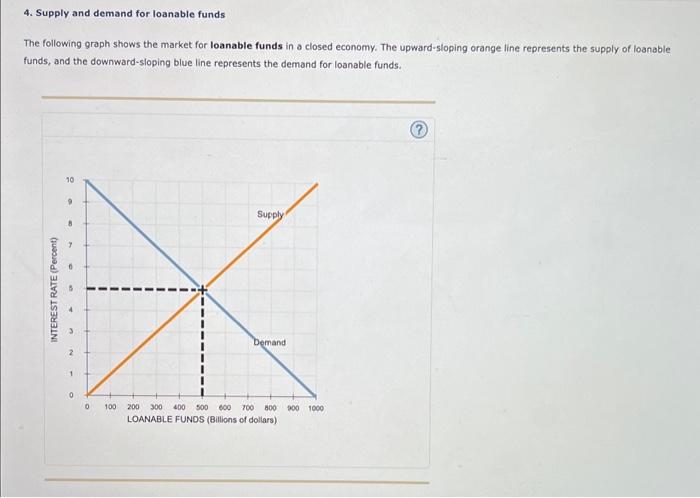
4. Supply and demand for loanable funds The following graph shows the market for loanable funds in a closed economy. The upward-sioping orange line represents the supply of loanable funds, and the downward-sloping blue line represents the demand for loanable funds.
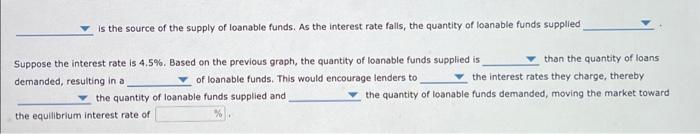
is the source of the supply of loanable funds. As the interest rate falls, the quantity of loanable funds supplied Suppose the interest rate is \( 4.5 \% \). Based on the previous graph, the quantity of loanable funds supplied is than the quantity of loans demanded, resulting in a of loanable funds. This would encourage lenders to the interest rates they charge, thereby the quantity of loanable funds supplied and the quantity of loanable funds demanded, moving the market toward the equilibrium interest rate of