Home /
Expert Answers /
Economics /
4-profit-maximization-in-the-cost-curve-diagram-the-following-graph-plots-daily-cost-curves-for-a-pa572
(Solved): 4. Profit maximization in the cost-curve diagram The following graph plots daily cost curves for a ...
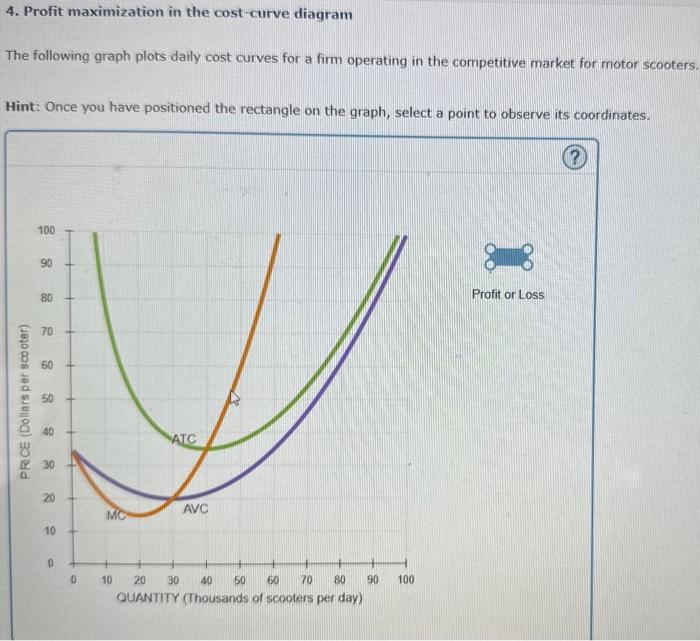
4. Profit maximization in the cost-curve diagram The following graph plots daily cost curves for a firm operating in the competitive market for motor scooters Hint: Once you have positioned the rectangle on the graph, select a point to observe its coordinates.
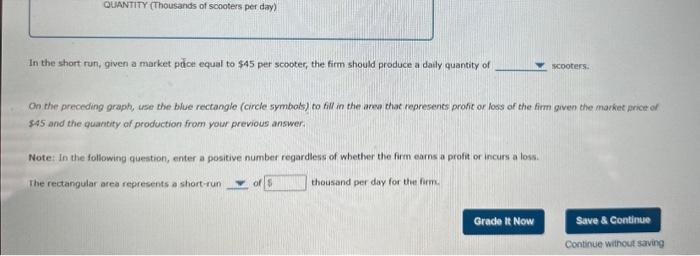
In the short run, given a market puce equal to \( \$ 45 \) per scooter, the firm should produce a datly quantity of On the preceding graph, use the blue rectangle (circle symbols) to fill in the arev that represencs profic or loss of the firm given the market arice of \( \$ 45 \) and the quantity of production from your previous answer. Note: In the following question, enter a positive number regardless of whether the firm earns a profit or incurs a loss. The rectangular area represents a short-rum thousand per doy for then firm.
Expert Answer
First blank: 37,500 instant pots P= MR MC= $45 MR is a horizontal line when P= $