Home /
Expert Answers /
Economics /
3-the-relationship-between-marginal-and-average-costs-following-table-presents-their-game-by-game-pa257
(Solved): 3. The relationship between marginal and average costs following table presents their game-by-game ...
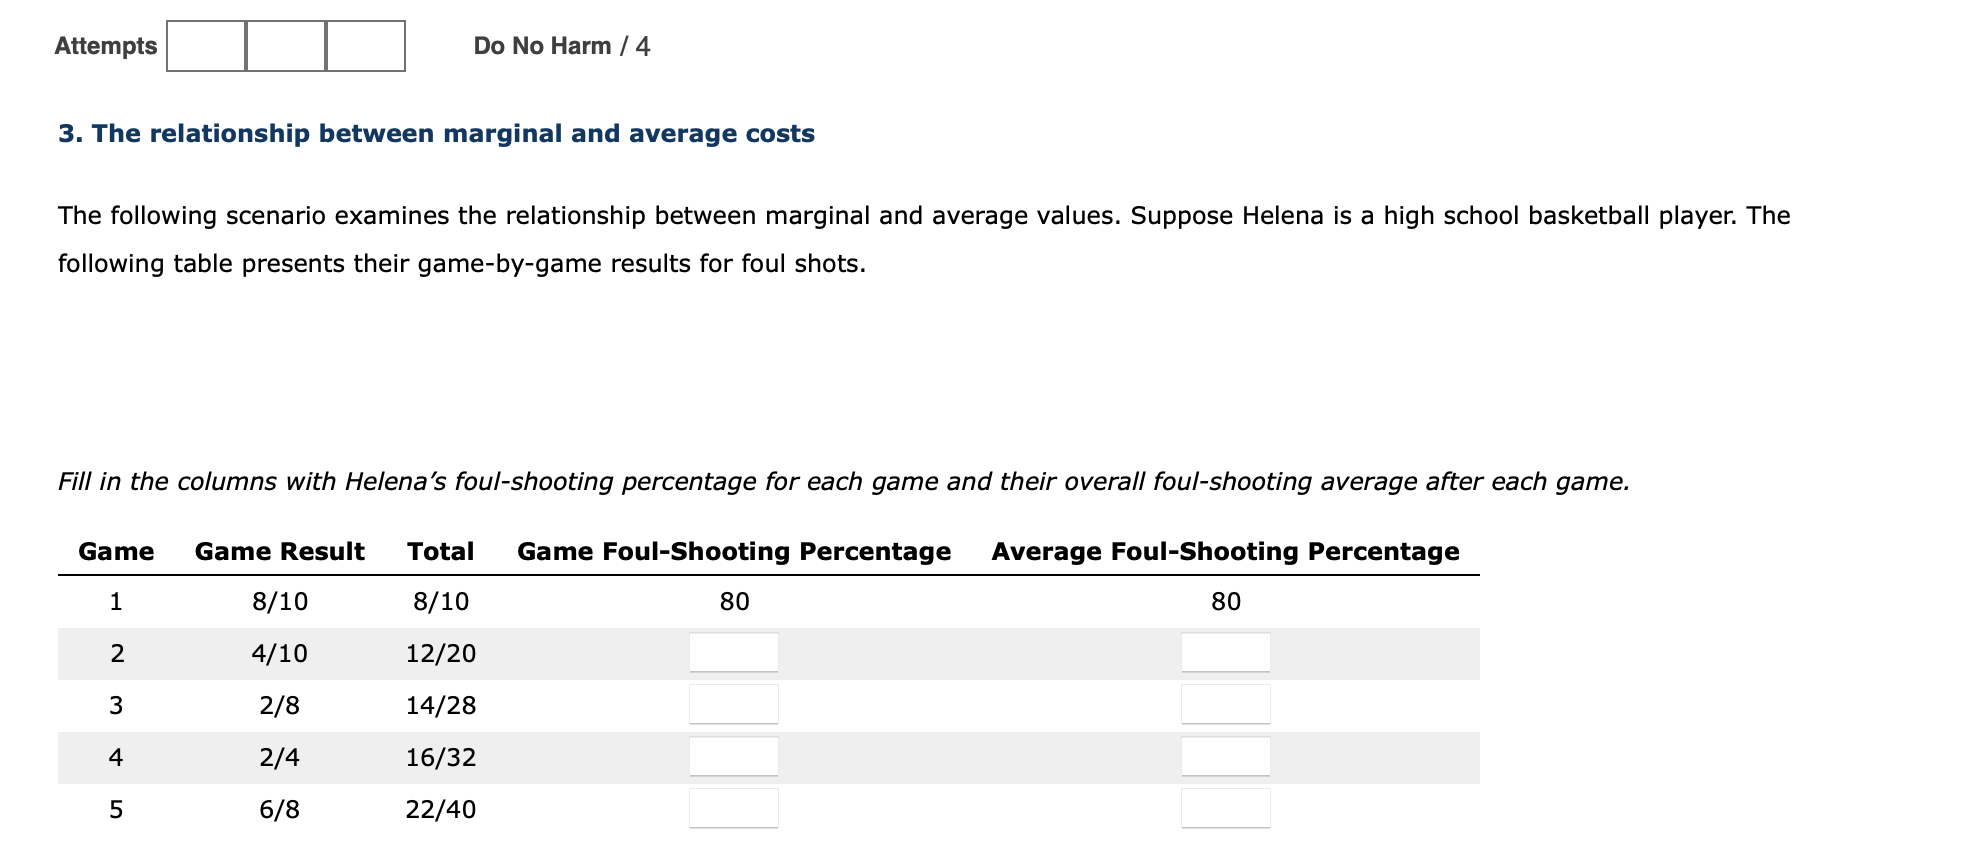
3. The relationship between marginal and average costs following table presents their game-by-game results for foul shots.
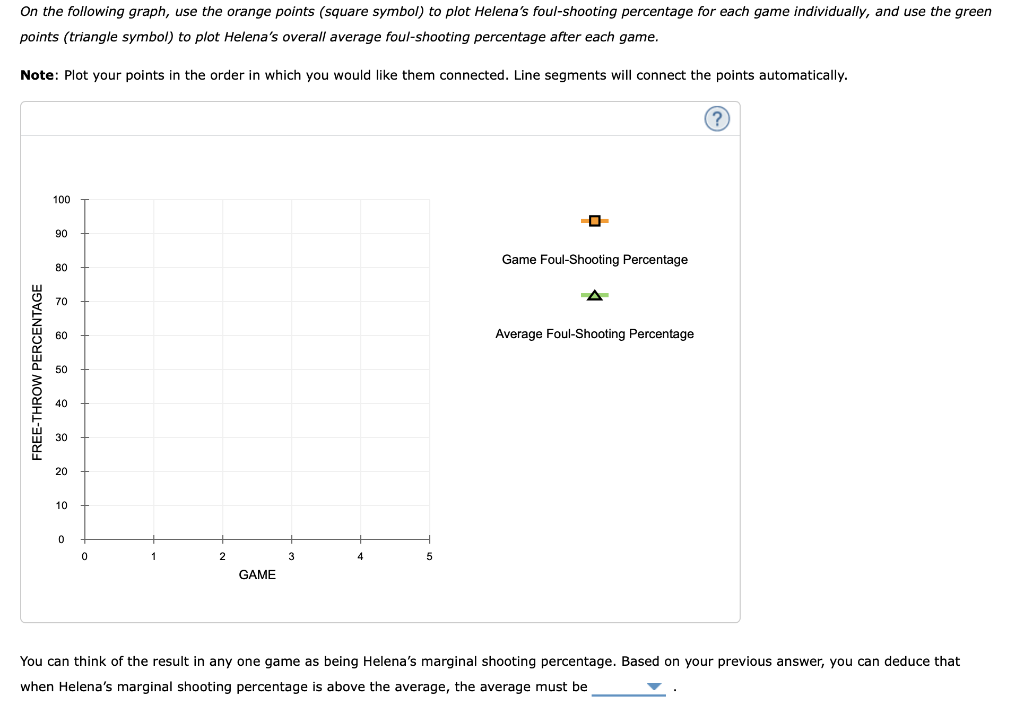
On the following graph, use the orange points (square symbol) to plot Helena's foul-shooting percentage for each game individually, and use the green points (triangle symbol) to plot Helena's overall average foul-shooting percentage after each game. Note: Plot your points in the order in which you would like them connected. Line segments will connect the points automatically. You can think of the result in any one game as being Helena's marginal shooting percentage. Based on your previous answer, you can deduce that when Helena's marginal shooting percentage is above the average, the average must be
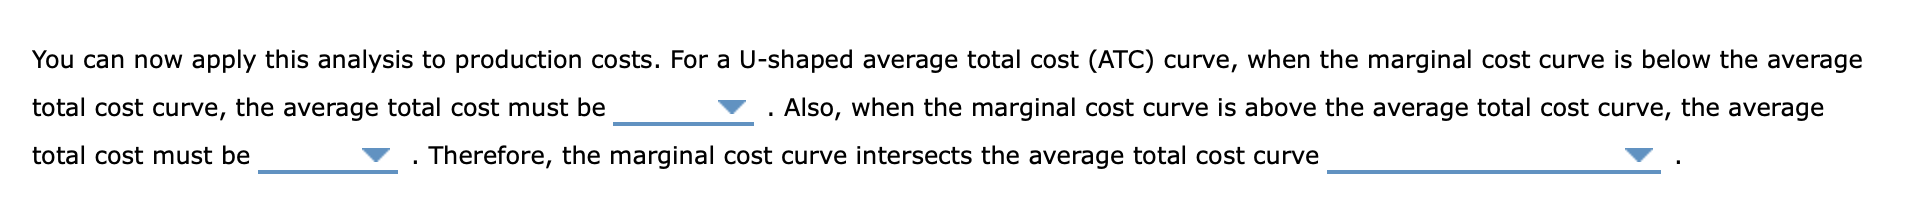
You can now apply this analysis to production costs. For a U-shaped average total cost (ATC) curve, when the marginal cost curve is below the average total cost curve, the average total cost must be . Also, when the marginal cost curve is above the average total cost curve, the average total cost must be . Therefore, the marginal cost curve intersects the average total cost curve
Expert Answer
(Part 1) The completed table as follows. Game result Total Game percentage Av