Home /
Expert Answers /
Economics /
3-the-graph-shows-the-average-total-cost-atc-curve-the-marginal-cost-mc-curve-the-average-va-pa249
(Solved): 3. The graph shows the average total cost (ATC) curve, the marginal cost (MC) curve, the average va ...
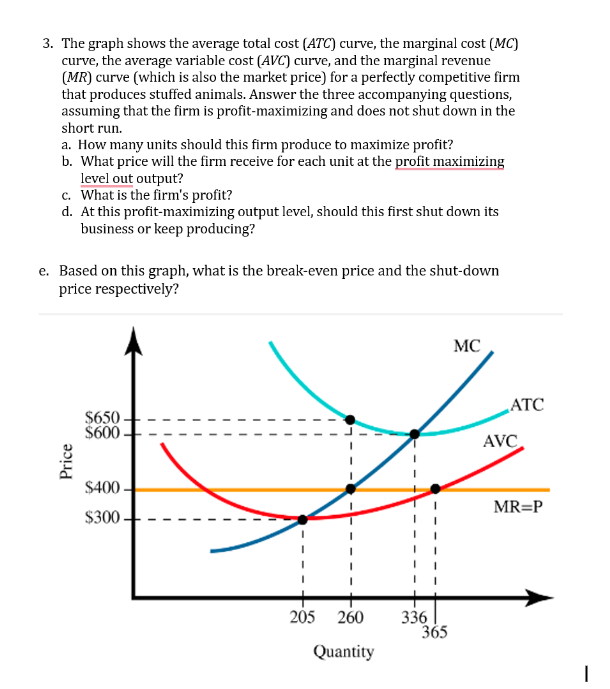
3. The graph shows the average total cost curve, the marginal cost curve, the average variable cost (AVC) curve, and the marginal revenue curve (which is also the market price) for a perfectly competitive firm that produces stuffed animals. Answer the three accompanying questions, assuming that the firm is profit-maximizing and does not shut down in the short run. a. How many units should this firm produce to maximize profit? b. What price will the firm receive for each unit at the profit maximizing level out output? c. What is the firm's profit? d. At this profit-maximizing output level, should this first shut down its business or keep producing?