Home /
Expert Answers /
Physics /
3-pv-cycle-diagram-the-mathrm-pv-diagram-below-shows-the-cyclic-process-a-b-c-involv-pa231
(Solved): 3 pV Cycle Diagram The \( \mathrm{pV} \) diagram below shows the cyclic process \( a b c \) involv ...
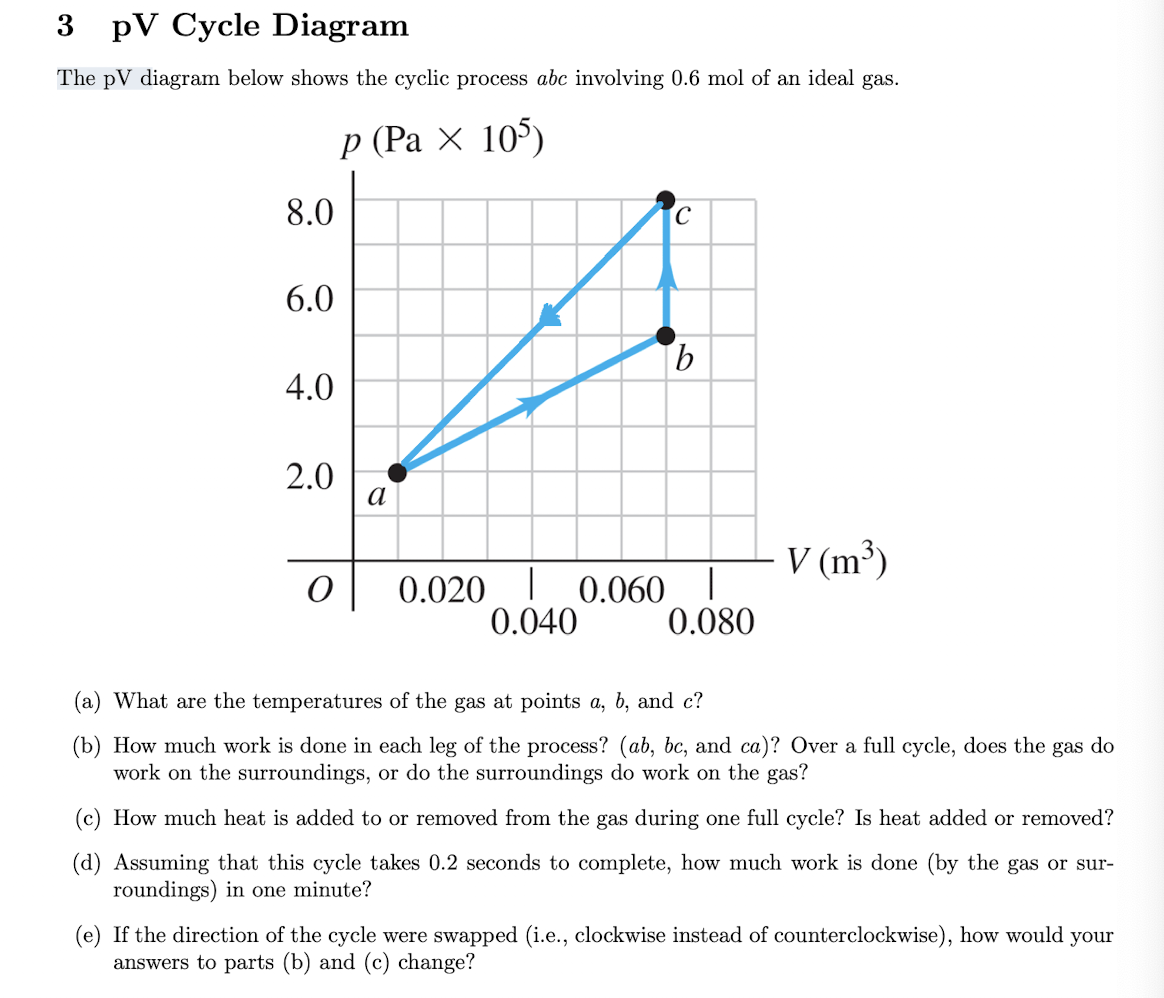
3 pV Cycle Diagram The \( \mathrm{pV} \) diagram below shows the cyclic process \( a b c \) involving \( 0.6 \mathrm{~mol} \) of an ideal gas. (a) What are the temperatures of the gas at points \( a, b \), and \( c \) ? (b) How much work is done in each leg of the process? \( (a b, b c \), and \( c a) \) ? Over a full cycle, does the gas do work on the surroundings, or do the surroundings do work on the gas? (c) How much heat is added to or removed from the gas during one full cycle? Is heat added or removed? (d) Assuming that this cycle takes \( 0.2 \) seconds to complete, how much work is done (by the gas or surroundings) in one minute? (e) If the direction of the cycle were swapped (i.e., clockwise instead of counterclockwise), how would your answers to parts (b) and (c) change?
Expert Answer
3 (a) USING IDEAL GAS EQUATION PV=nRT T=PV/nR TEMPERATURE AT THE POINT a T(a)= 2×105×0.010/0.6×8.31=401.1K TEMP