Home /
Expert Answers /
Statistics and Probability /
2-midterm-exam-scores-for-a-small-advanced-anatomy-class-are-provided-below-scores-represent-perc-pa279
(Solved): 2) Midterm exam scores for a small advanced anatomy class are provided below. Scores represent perc ...
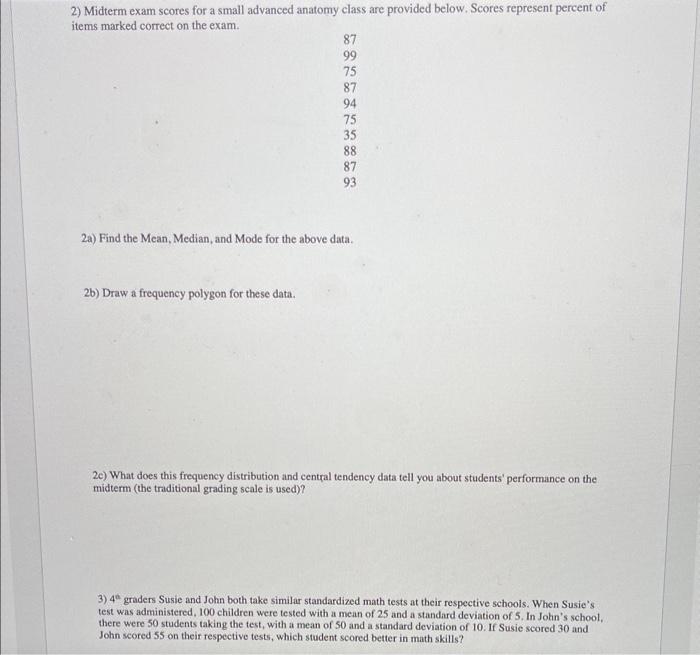
2) Midterm exam scores for a small advanced anatomy class are provided below. Scores represent percent of items marked correct on the exam. 87 99 75 87 94 75 35 88 87 93 2a) Find the Mean, Median, and Mode for the above data. 2b) Draw a frequency polygon for these data. 20) What does this frequency distribution and central tendency data tell you about students' performance on the midterm (the triditional grading scale is used)? test was administered, 100 children were tested with a mean of 25 and a standard deviation of 5 . In John's school, there were 50 students taking the test, with a mean of 50 and a standard deviation of 10 . If Susie scored 30 and John scored 55 on their respective tests, which student scored better in math skills?
Expert Answer
2a). Arranging the data in ascending order : 35, 75,75, 87, 87, 87, 88, 93, 94, 99 ?MEAN = Total of all values / Total numbers = 820 / 10 = 82 Hence t