Home /
Expert Answers /
Statistics and Probability /
14-diameter-of-douglas-fir-trees-the-diameter-of-the-douglas-fir-tree-is-measured-at-a-height-of-pa367
(Solved): 14. Diameter of Douglas Fir Trees The diameter of the Douglas fir tree is measured at a height of \ ...
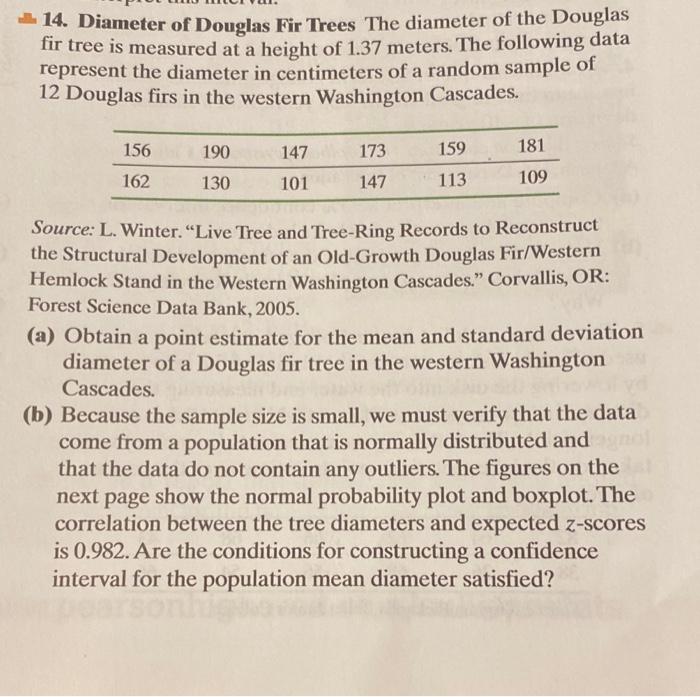
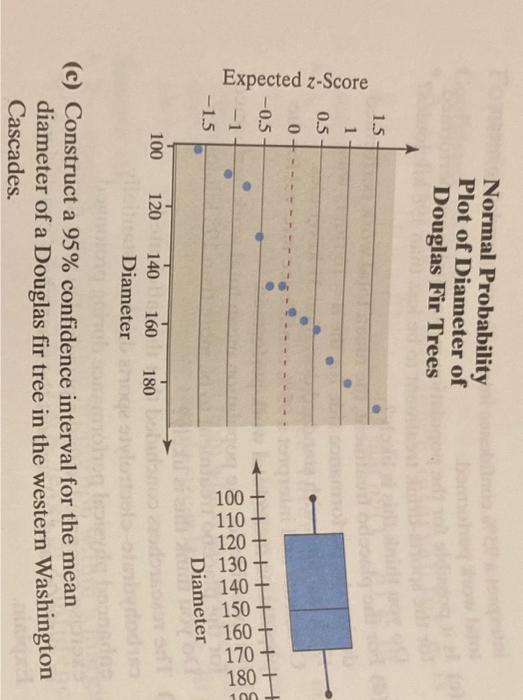
14. Diameter of Douglas Fir Trees The diameter of the Douglas fir tree is measured at a height of \( 1.37 \) meters. The following data represent the diameter in centimeters of a random sample of 12 Douglas firs in the western Washington Cascades. Source: L. Winter. "Live Tree and Tree-Ring Records to Reconstruct the Structural Development of an Old-Growth Douglas Fir/Western Hemlock Stand in the Western Washington Cascades." Corvallis, OR: Forest Science Data Bank, 2005. (a) Obtain a point estimate for the mean and standard deviation diameter of a Douglas fir tree in the western Washington Cascades. (b) Because the sample size is small, we must verify that the data come from a population that is normally distributed and that the data do not contain any outliers. The figures on the next page show the normal probability plot and boxplot. The correlation between the tree diameters and expected \( z \)-scores is \( 0.982 \). Are the conditions for constructing a confidence interval for the population mean diameter satisfied?
Normal Probability Plot of Diameter of Douglas Fir Trees (c) Construct a \( 95 \% \) confidence interval for the mean diameter of a Douglas fir tree in the western Washington Cascades.
\#1. Use Minitab to do problem \#14 on page 425. a. Construct the \( 95 \% \) CI using Minitab. b. Interpret the CI.
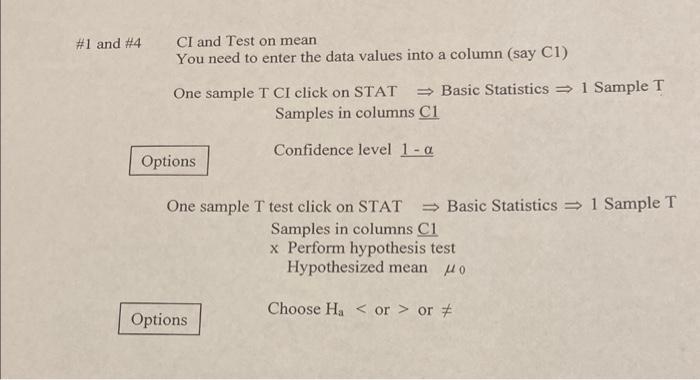
1 and \#4 CI and Test on mean You need to enter the data values into a column (say C1) One sample T CI click on STAT \( \Rightarrow \) Basic Statistics \( \Rightarrow 1 \) Sample T Samples in columns \( \underline{\mathrm{Cl}} \) Confidence level \( 1-\alpha \) One sample T test click on STAT \( \Rightarrow \) Basic Statistics \( \Rightarrow 1 \) Sample T Samples in columns \( \mathrm{Cl} \) x Perform hypothesis test Hypothesized mean \( \mu_{0} \) Choose \( \mathrm{H}_{\mathrm{a}}< \) or \( > \) or \( \neq \)