Home /
Expert Answers /
Economics /
10-interpreting-the-supply-of-labor-the-following-graph-depicts-the-labor-supply-curve-for-kyoko-pa632
(Solved): 10. Interpreting the supply of labor The following graph depicts the labor supply curve for Kyoko, ...
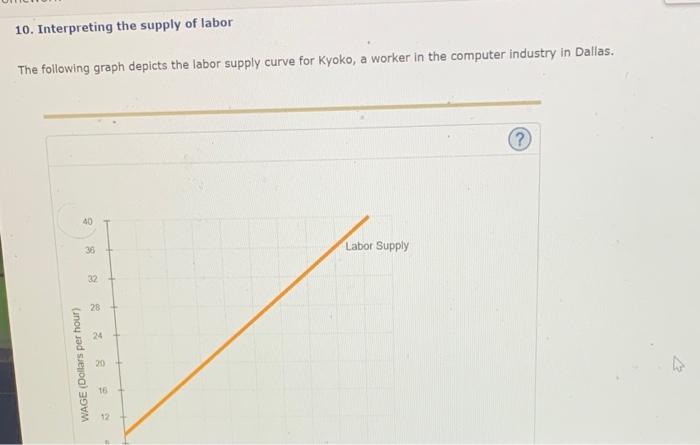
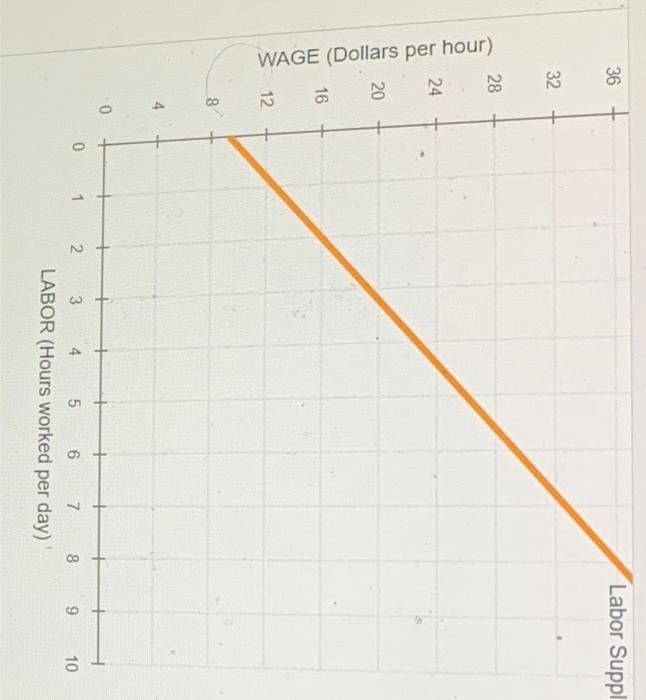
10. Interpreting the supply of labor The following graph depicts the labor supply curve for Kyoko, a worker in the computer industry in Dallas.
LABOR (Hours worked per day)
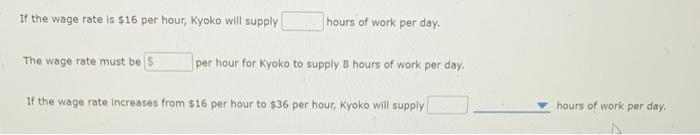
If the wage rate is \( \$ 16 \) per hour, Kyoko will supply hours of work per day. The wage rate must be per hour for Kyoko to supply 8 hours of work per day. If the wage rate increases from \( \$ 16 \) per hour to \( \$ 36 \) per hour, Kyoko will supply hours of work per day.
Expert Answer
Labor supply curve depicts th