Home /
Expert Answers /
Economics /
10-a-market-supply-and-demand-analysis-the-following-graph-shows-the-monthly-demand-and-supply-cu-pa784
(Solved): 10. A market supply and demand analysis The following graph shows the monthly demand and supply cu ...
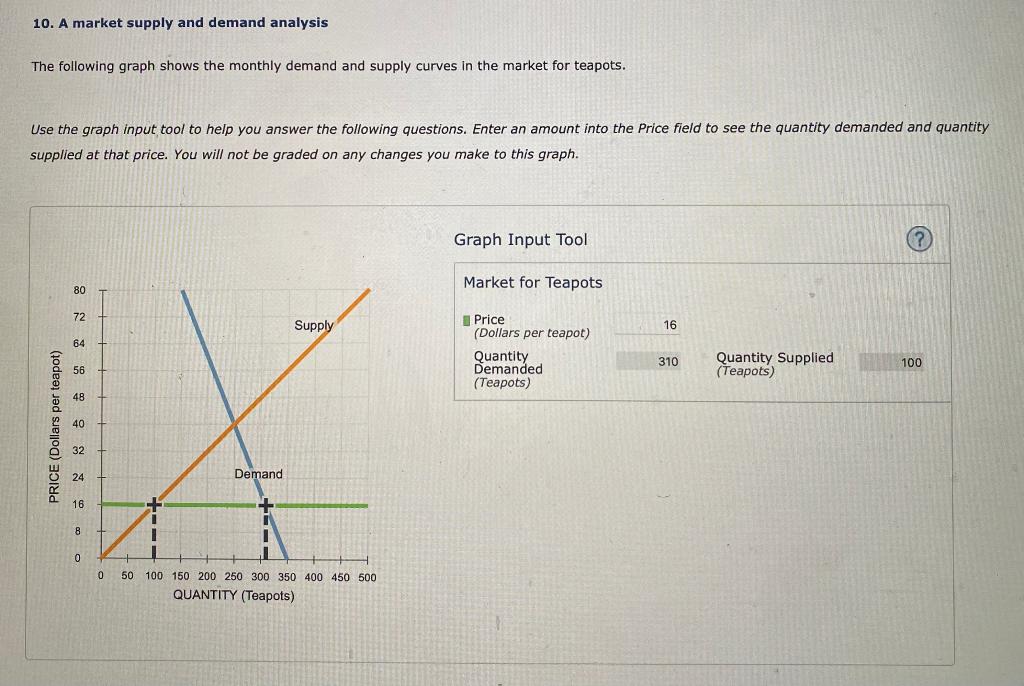
10. A market supply and demand analysis The following graph shows the monthly demand and supply curves in the market for teapots. Use the graph input tool to help you answer the following questions. Enter an amount into the Price field to see the quantity demanded and quantity supplied at that price. You will not be graded on any changes you make to this graph.
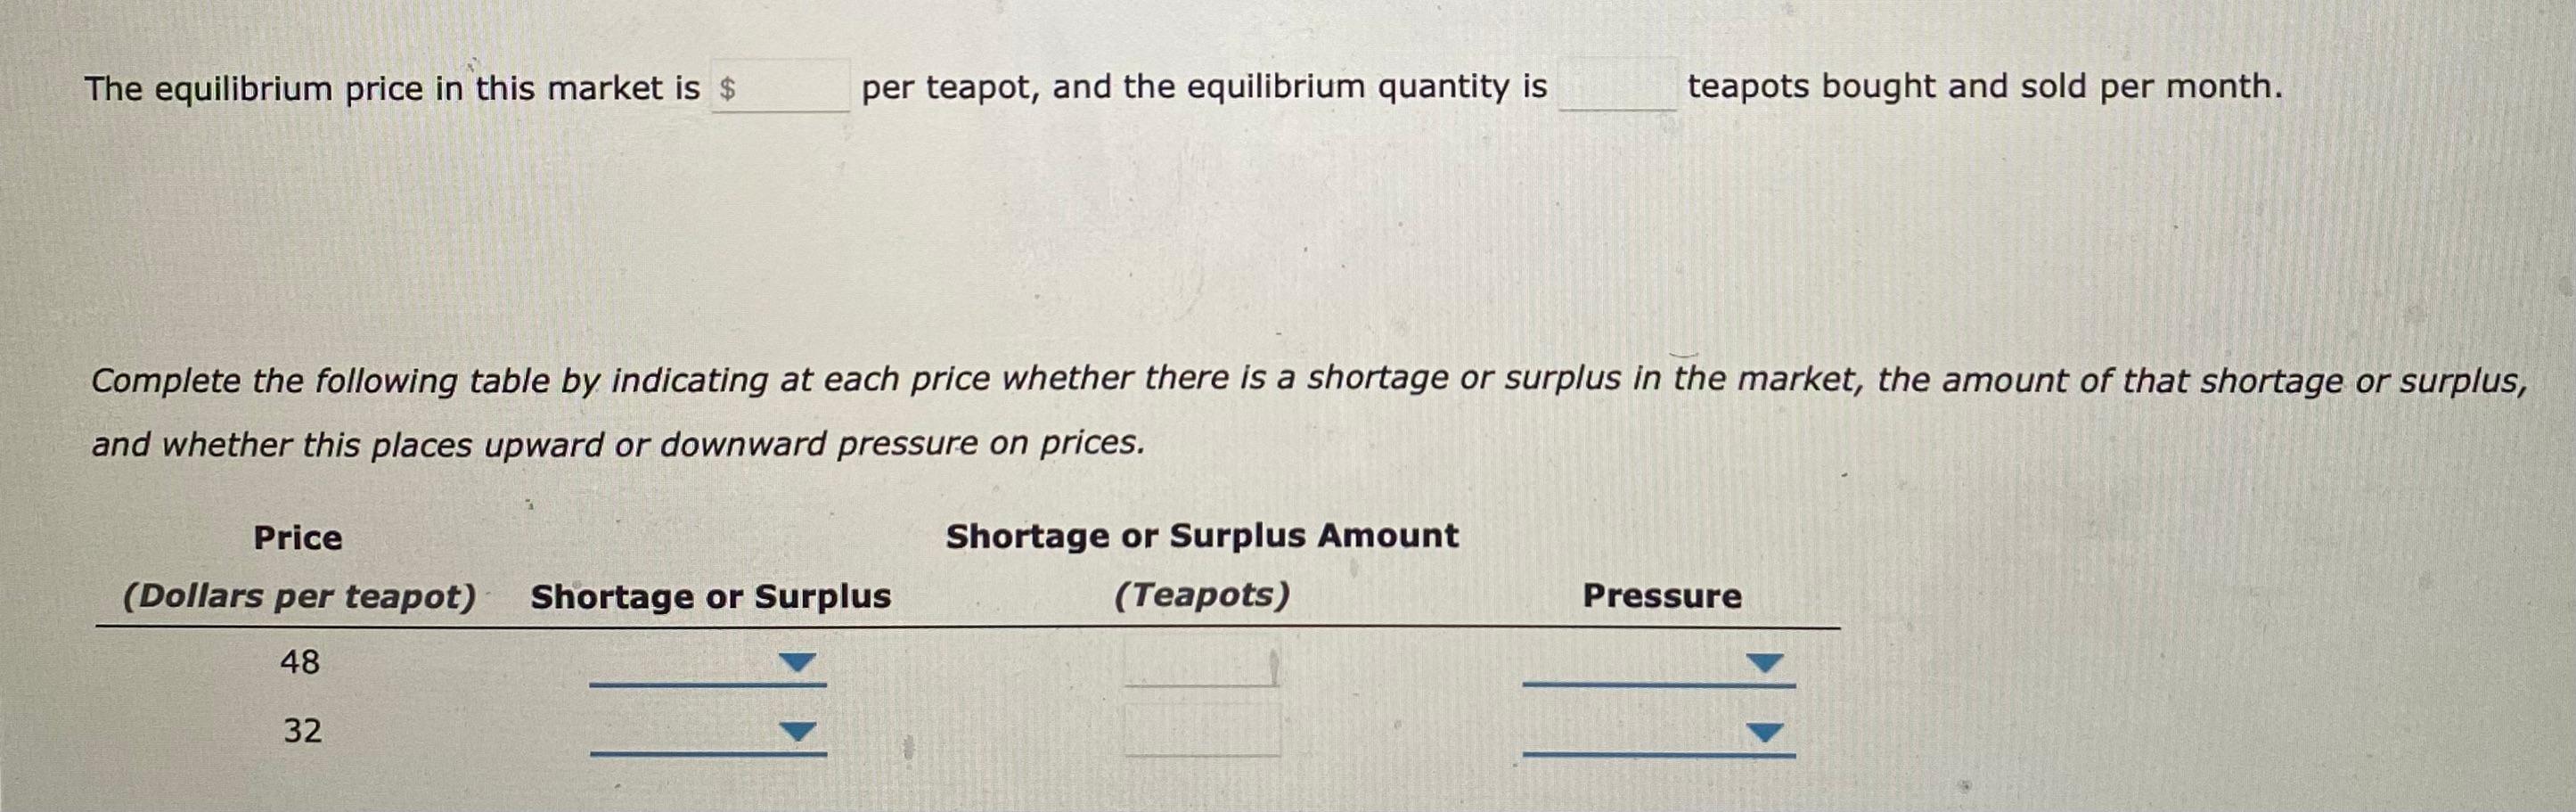
The equilibrium price in this market is per teapot, and the equilibrium quantity is teapots bought and sold per month. and whether this places upward or downward pressure on prices.