Home /
Expert Answers /
Calculus /
1-the-graph-of-marginal-cost-and-marginal-revenue-curves-are-shown-at-the-right-five-different-q-pa770
(Solved): 1. The graph of marginal cost and marginal revenue curves are shown at the right. Five different q ...
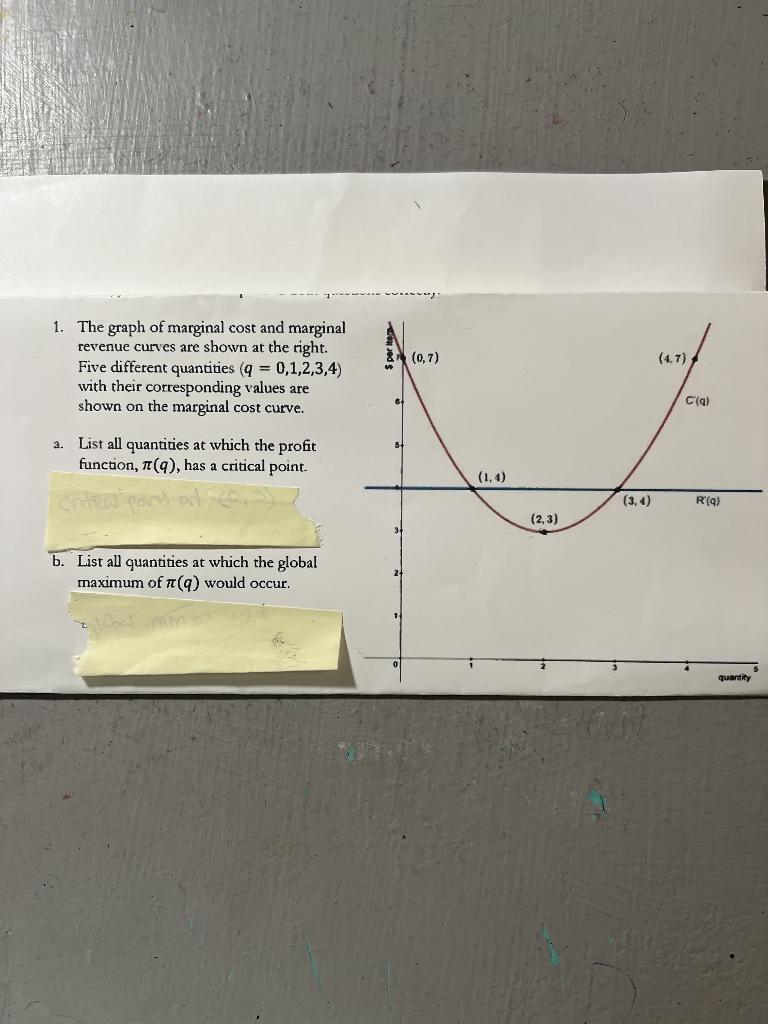
1. The graph of marginal cost and marginal revenue curves are shown at the right. Five different quantities \( (q=0,1,2,3,4 \) ) with their corresponding values are shown on the marginal cost curve. a. List all quantities at which the profit function, \( \pi(q) \), has a critical point. b. List all quantities at which the global maximum of \( \pi(q) \) would occur.
Expert Answer
Profit = revenue = cost So profit function ?(q)=R(q)?C(q) For critical point Differentiate with respec