Home /
Expert Answers /
Economics /
1-the-following-graph-shows-per-unit-costs-marginal-costs-average-total-costs-and-average-vari-pa540
(Solved): 1. The following graph shows per unit costs - marginal costs, average total costs, and average vari ...
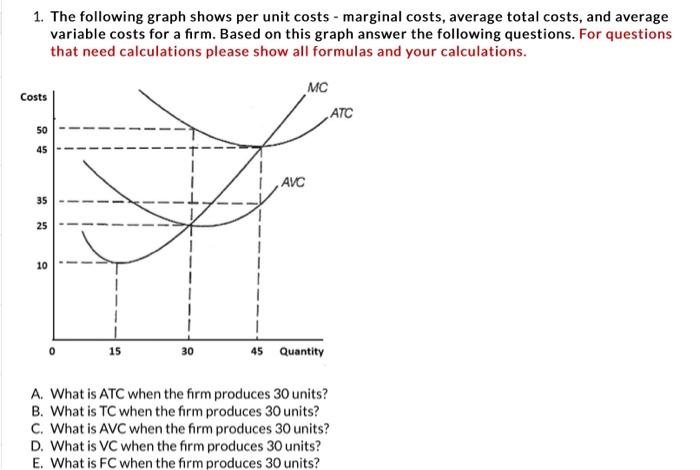
1. The following graph shows per unit costs - marginal costs, average total costs, and average variable costs for a firm. Based on this graph answer the following questions. For questions that need calculations please show all formulas and your calculations. A. What is ATC when the firm produces 30 units? B. What is TC when the firm produces 30 units? C. What is AVC when the firm produces 30 units? D. What is VC when the firm produces 30 units? E. What is FC when the firm produces 30 units?
Expert Answer
Cost of production refers to all expenses