Home /
Expert Answers /
Statistics and Probability /
1-the-data-in-the-accompanying-table-provide-the-resistivity-of-platinum-versus-temperature-temp-pa564
(Solved): 1. The data in the accompanying table provide the resistivity of platinum versus temperature. Temp ...
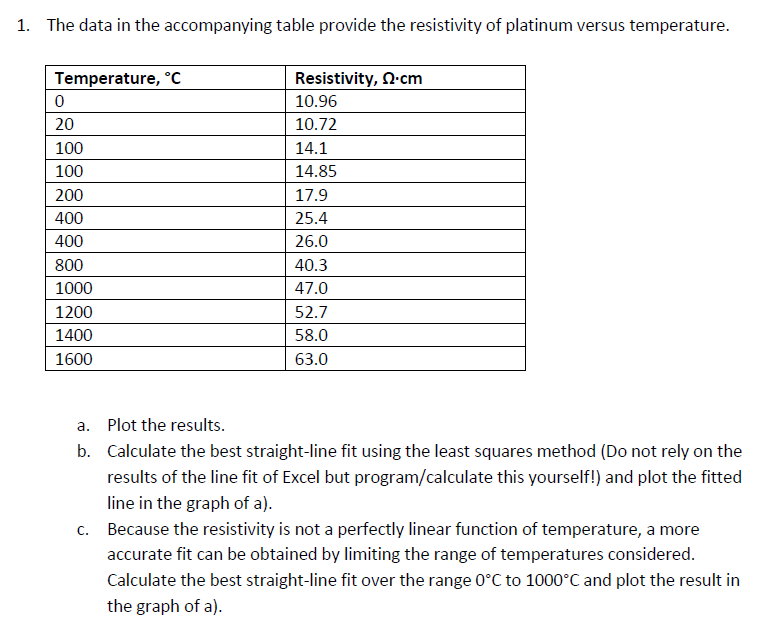
1. The data in the accompanying table provide the resistivity of platinum versus temperature. Temperature, °C Resistivity, Q.cm 0 10.96 20 10.72 100 14.1 100 14.85 200 17.9 400 25.4 400 26.0 800 40.3 1000 47.0 1200 52.7 1400 58.0 1600 63.0 a. Plot the results. b. Calculate the best straight-line fit using the least squares method (Do not rely on the results of the line fit of Excel but program/calculate this yourself!) and plot the fitted line in the graph of a). c. Because the resistivity is not a perfectly linear function of temperature, a more accurate fit can be obtained by limiting the range of temperatures considered. Calculate the best straight-line fit over the range 0°C to 1000°C and plot the result in the graph of a).
Expert Answer
a) Following is the scatter