Home /
Expert Answers /
Economics /
1-income-inequality-and-the-poverty-rate-the-following-table-summarizes-the-income-distribution-pa782
(Solved): 1. Income inequality and the poverty rate The following table summarizes the income distribution ...
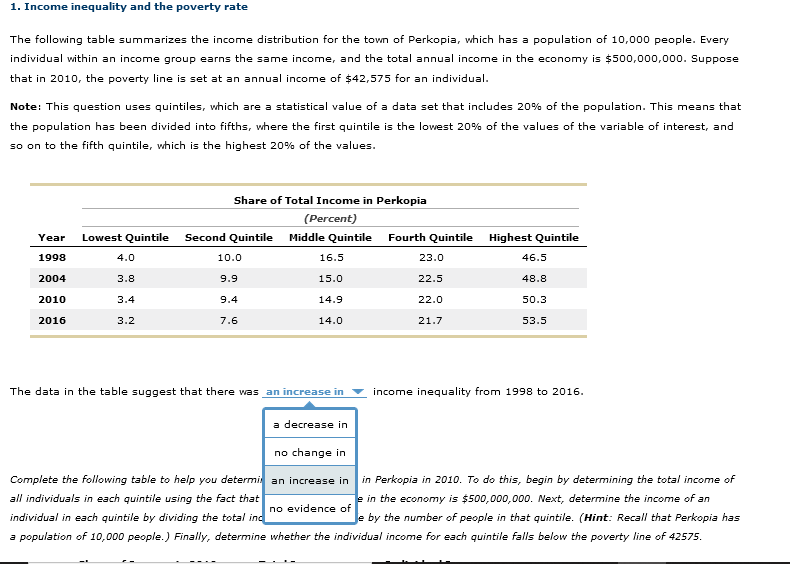
1. Income inequality and the poverty rate The following table summarizes the income distribution for the town of Perkopia, which has a population of 10 , 000 people. Every individual within an income group earns the same income, and the total annual income in the economy is \( \$ 500 \), 000 , 000 . Suppose that in 2010 , the poverty line is set at an annual income of \( \$ 42,575 \) for an individual. Note: This question uses quintiles, which are a statistical value of a data set that includes \( 20 \% \) of the population. This means that the population has been divided into fifths, where the first quintile is the lowest \( 20 \% \) of the values of the variable of interest, and so on to the fifth quintile, which is the highest \( 20 \% \) of the values. The data in the table suggest that there was income inequality from 1998 to 2016. Complete the following table to help you determi in Perkopia in 2010. To do this, begin by determining the total income of all individuals in each quintile using the fact that \( \quad \) in the economy is \( \$ 500,000,000 \). Next, determine the income of an individual in each quintile by dividing the total in \( \quad \). by the number of people in that quintile. (Hint: Recall that Perkopia has a population of 10,000 people.) Finally, determine whether the individual income for each quintile falls below the poverty line of 42575.
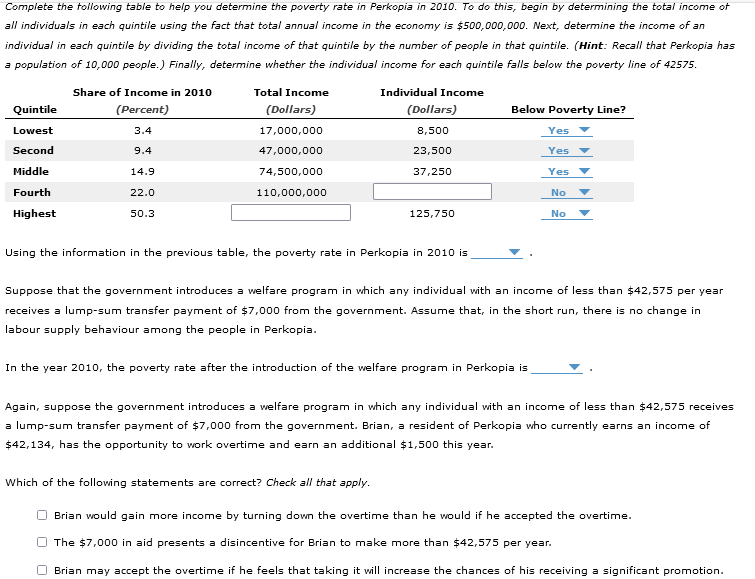
Complete the tollowing table to help you determine the poverty rate in Perkopia in 2010 . To do this, begin by determining the total income of all individuals in each quintile using the fact that total annual income in the economy is \( \$ 500,000,000 \). Next, determine the income of an individual in each quintile by dividing the total income of that quintile by the number of people in that quintile. (Hint: Recall that Perkopia has a population of 10,000 people.) Finally, determine whether the individual income for each quintile falls below the poverty line of 42575. Using the information in the previous table, the poverty rate in Perkopia in 2010 is Suppose that the government introduces a welfare program in which any individual with an income of less than \( \$ 42,575 \) per year receives a lump-sum transfer payment of \( \$ 7,000 \) from the government. Assume that, in the short run, there is no change in labour supply behaviour among the people in Perkopia. In the year 2010 , the poverty rate after the introduction of the welfare program in Perkopia is Again, suppose the government introduces a welfare program in which any individual with an income of less than \( \$ 42,575 \) receives a lump-sum transfer payment of \( \$ 7,000 \) from the government. Brian, a resident of Perkopia who currently earns an income of \( \$ 42,134 \), has the opportunity to work overtime and earn an additional \( \$ 1,500 \) this year. Which of the following statements are correct? Check all that apply. Brian would gain more income by turning down the overtime than he would if he accepted the overtime. The \( \$ 7,000 \) in aid presents a disincentive for Brian to make more than \( \$ 42,575 \) per year. Brian may accept the overtime if he feels that taking it will increase the chances of his receiving a significant promotion.
Expert Answer
1 ) an increase see in the table difference between highest and lowest quantile 1998=46.5?4=42.5 2004=48.8?3.8=45 2010=50.3?3.4=46.9 2016=53.5?3.2=50.