Home /
Expert Answers /
Earth Sciences /
1-based-on-fig-13-11-where-are-the-areas-of-greatest-subsidence-in-the-santa-clara-valley-2-wh-pa137
(Solved): 1. Based on Fig. 13.11, where are the areas of greatest subsidence in the Santa Clara Valley? 2. Wh ...
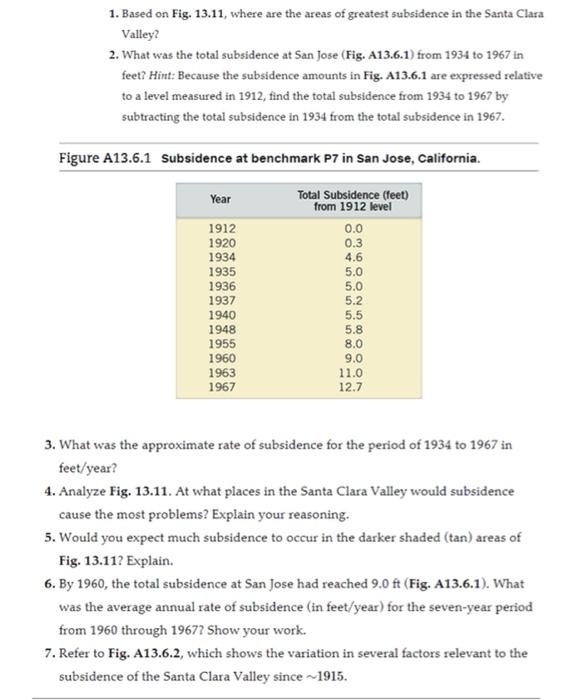
1. Based on Fig. 13.11, where are the areas of greatest subsidence in the Santa Clara Valley? 2. What was the total subsidence at San Jose (Fig. 113.6.1from 1934 to 1967 in feet? Hint: Because the subsidence amounts in Fig. A13.6.1 are expressed relative to a level measured in 1912, find the total subsidence from 1934 to 1967 by subtracting the total subsidence in 1934 from the total subsidence in 1967. Figure A13.6.1 Subsidence at benchmark P7 in San Jose, California. Year Total Subsidence (feet) from 1912 level 0.0 1912 1920 1934 1935 1936 1937 1940 1948 1955 1960 1963 1967 0.3 4.6 5.0 5.0 5.2 5.5 5.8 8.0 9.0 11.0 12.7 un un 3. What was the approximate rate of subsidence for the period of 1934 to 1967 in feet/year? 4. Analyze Fig. 13.11. At what places in the Santa Clara Valley would subsidence cause the most problems? Explain your reasoning. 5. Would you expect much subsidence to occur in the darker shaded (tan) areas of Fig. 13.11? Explain. 6. By 1960, the total subsidence at San Jose had reached 9.0 ft (Fig. 113.6.1). What was the average annual rate of subsidence (in feet/year) for the seven-year period from 1960 through 19677 Show your work. 7. Refer to Fig. A13.6.2, which shows the variation in several factors relevant to the subsidence of the Santa Clara Valley since 1915.