Home /
Expert Answers /
Physics /
1-a-the-figure-shows-a-velocity-v-versus-time-graph-for-an-object-draw-the-position-x-versu-pa551
(Solved): 1. (a) The figure shows a velocity (v) versus time graph for an object. Draw the position (x) versu ...
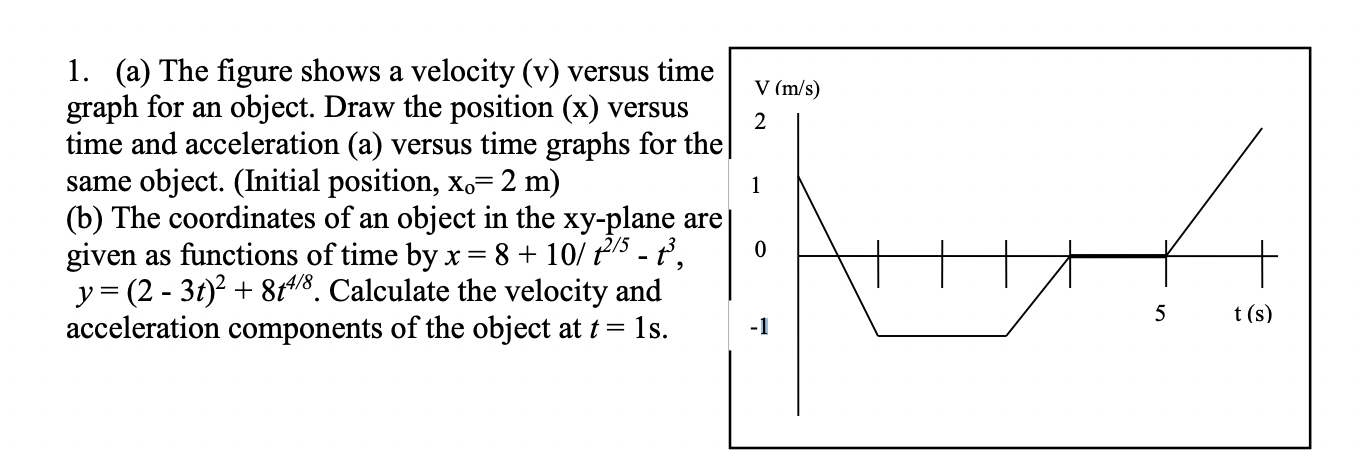
1. (a) The figure shows a velocity (v) versus time graph for an object. Draw the position (x) versus time and acceleration (a) versus time graphs for th same object. (Initial position, ) (b) The coordinates of an object in the xy-plane ar given as functions of time by , . Calculate the velocity and acceleration components of the object at .
Expert Answer
For sketching the graph we will use the concept , how the V vs t graph is behaving in each region.Fo...