Home /
Expert Answers /
Operations Management /
1-4-4-the-demand-for-electric-power-supplied-by-eskom-over-the-period-2003-to-2009-is-shown-in-the-pa595
(Solved): 1.4.4 The demand for electric power supplied by Eskom over the period 2003 to 2009 is shown in the ...
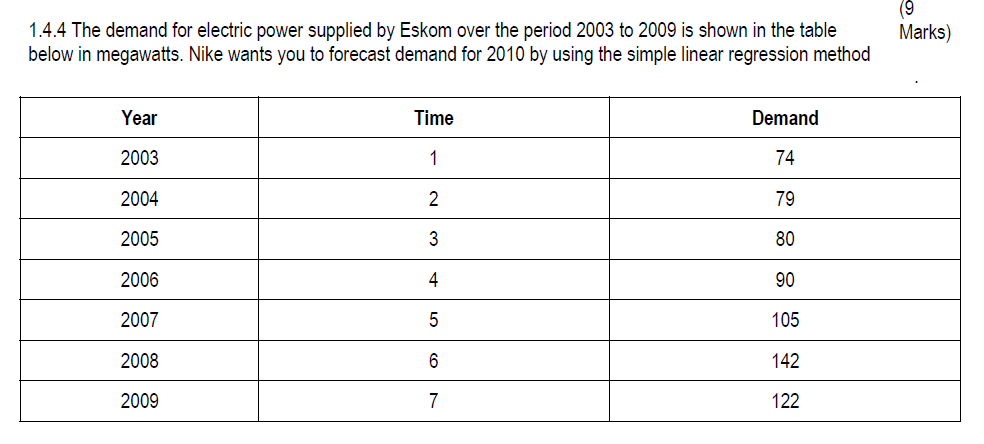
1.4.4 The demand for electric power supplied by Eskom over the period 2003 to 2009 is shown in the table below in megawatts. Nike wants you to forecast demand for 2010 by using the simple linear regression method
Expert Answer
To forecast demand for 2010 using simple linear regression, we need to first plot the data to visualize the relationship between time and demand. We can use a scatter plot for this purpose. Here is a scatter plot of the data:Year Time (t) Demand (y)2003 1 742004 2 792005 3 802006 4 902007 5 1052008 6 1422009 7 122 From the scatter plot, it appears that there is a positive linear relationship between time and demand, with demand increasing over time.Next, we can calculate the equation of the regression line using the method of least squares. The equation of the regression line is:where y is the dependent variable (demand), x is the independent variable (time), b is the slope of the line, and a is the intercept.