Home /
Expert Answers /
Statistics and Probability /
1-10-the-histograms-shown-below-contain-the-test-scores-for-three-different-sections-of-a-course-pa116
(Solved): 1. (10) The histograms shown below contain the test scores for three different sections of a course ...
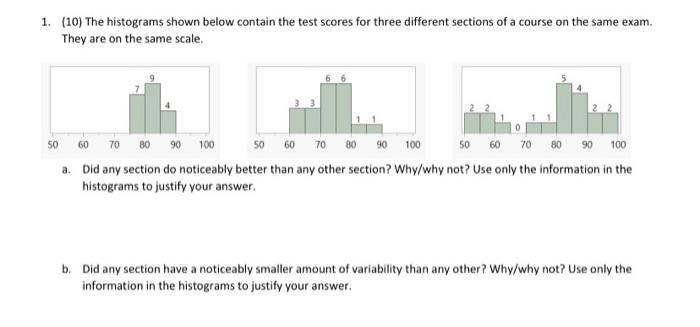
1. (10) The histograms shown below contain the test scores for three different sections of a course on the same exam. They are on the same scale. a. Did any section do noticeably better than any other section? Why/why not? Use only the information in the histograms to justify your answer. b. Did any section have a noticeably smaller amount of variability than any other? Why/why not? Use only the information in the histograms to justify your answer.
Expert Answer
a) Answer --> Section-1 is better than others two section-2 and s